Dr. Jay Sheth, S18167, Dr. Giridhar Anantharaman, Dr.Mahesh G
Abstract
Purpose:
To illustrate changes in renal parameters(RP; Creatinine & Urea)& choroidal thickness(CT) in DR.
Method:
Prospective study of 62 NPDR & 52 PDR eyes undergoing enhanced-depth imaging(EDI)-OCT for measurement of CT subfoveally & at 1500 and 3000µ nasally & temporally in addition assessment of RP & HbA1C level.
Result:
Between the NPDR & PDR group, there was no significant difference in CT,RP & HbA1C level. However, there was significant positive correlation between increasing levels of both creatinine & urea with CT in PDR group(p=0.01 & p=0.04 respectively) but not in NPDR group(p=0.2 each).No association was found between CMT & CT with HbA1C &between CMT & RP.
Conclusion:
Current results indicate that concomitant renal dysfunction has greater effect in PDR stage as compared to NPDR as reflected by increasing CT with rising creatinine & urea levelpossibly due to systemic fluid accumulation & secondary ocular hemodynamic changes besides choroidal autoregulatory dysfunction.
Introduction
Diabetic retinopathy (DR) is one of the leading causes of blindness in modern world. However, the causes of vascular pathologyin diabetes are not fully understood and explored.1-3 Patients with diabetes have dysfunctional retinal perfusion.3Although these deficiencies may in part reflect responses to a primaryevent occurring in the retinal microvasculature, they may independentlycontribute to the development and progression ofthis disease.1
The pathogenesis and clinical signs of diabetic retinopathy are linked to retinal vascular damage, but evidence in literature insinuates parallel existence of choroidalvasculopathy.4Choroidal vessels are responsible for the nutrient and oxygen supply of outer third of retina, and thereby are chiefly engaged in maintaining the vascularity of the fovea region consisting of predominantly the outer retinal layers.5 Various angiographic, laser Doppler flowmetry and histologic studies in eyes with diabetic retinopathy have shown proven occurrence of choroidalvasculopathy in form of delayed choroidal filling, reduced choroidal blood flow and choriocapillaris “dropout” (a nonperfusion and/or a complete attenuation of the choriocapillaris) respectively.4, 6, 7 But these are invasive techniques of assessment.
The advancement in Spectral domain optical coherence tomography in the form of Enhanced Depth Imaging(EDI) permits a non-invasive, 3-dimensional, higher definition view of the choroid till the choroidoscleral interface.8 Many researchers have evaluated changes in CT in various stages of DR with variable results ranging from thickening, thinning, to even no changes as DR progresses from nonproliferative diabetic retinopathy (NPDR) to proliferative diabetic retinopathy (PDR).9-12 The literature remains abstruse concerning the alterations in the choroid.
Patients with diabetes, especially with retinopathy have concurrent nephropathy changes too. End state kidney disease (ESKD) is commonly associated with severe DR.13, 14 These patients may need hemodialysis as they have excessive systemic fluid and uremic substance collection. Few authors have evaluated the role of hemodialysis on choroidal thickness (CT) in diabetic patients with conflicting results. Jung et al15 found increase in CT while Izhibazawa et al16 found choroidal thinning after hemodialysis in patients with Diabetic ESKD. However, till date, no study has been done to explore the complex interplay between renal parameters, including serum creatinine and blood urea levels, and choroidal thickness in Diabetic Retinopathy.
In this study, we intend to analyze the association between the aforementioned renal parameters in diabetic retinopathy and choroidal thickness using EDI-OCT in the macular region. In addition, we aim to scrutinize the variations in these parameters through the continuum of diabetic retinopathy stages.
Materials and Methods
Treatment-naive patients with diabetes presenting to the Vitreo-Retinal Clinic of Giridhar Eye Institute,Kerala, India, between July 2015 and September 2015 were included in the study.This study was conducted in accordance to the tenets of Declaration of Helsinki and was approved by the Institutional Review Board. Written informed consent was obtained from each patient. Patients with myopia more than 3 diopters (D), concurrent macular pathologies such as age-related macular degeneration (AMD) or choroidalneovascular membranes (CNV) or retinal vein occlusion (RVO) were excluded.All recruited patients underwent complete ophthalmic examination, including fundus evaluation along with grading of diabetic retinopathy (DR) based on Early Treatment of Diabetic Retinopathy Study (ETDRS) grading system17 by slit-lamp biomicroscopy through mydriatic pupil, by a single experienced retina specialist (A.G.). The participants were divided into two groups: those with non-proliferative diabetic retinopathy (NPDR) and those with proliferative diabetic retinopathy (PDR).
Enhanced depth imaging optical coherence tomography (EDI-OCT (Spectralis HRA + OCT, Heidelberg Engineering) was performed for all patients. CT was measured manually with the help of built-in callipers in OCT software. Measurements weremadefrom the outer portion of hyperreflective line corresponding to the retinal pigment epithelium to the inner portion of hyperreflective zone corresponding to choroidoscleral junction by a single masked observer. They were obtained in the subfoveal region (Subfovealchoroidal thickness; SFCT) and at a distance of 1500µm and 3000µm from the locus of measurement of SFCT in nasal and temporal quadrants (N1500, N3000, T1500, T3000) (Figure 1). Automated central macular thickness (CMT) was calculated using the 25-line raster scan protocol. After 12 hours of overnight fasting, blood samples were collected for estimation of blood urea, serum creatinine and serum HbA1C levels.
Figure 1: Horizontal enhanced depth imaging optical coherence tomography (EDI-OCT) scan of the same 63/M diabetic patient with presence of retinopathy changes. The choroidal thickness was measured from the outer portion of hyper-reflective line corresponding to the retinal pigment epithelium to the inner portion of hyper-reflective zone corresponding to choroido-scleral junction in the sub-foveal region (SFCT) and also at a distance of 1500µm and 3000µm from the locus of measurement of SFCT in nasal and temporal quadrants (N1500, N3000, T1500, T3000).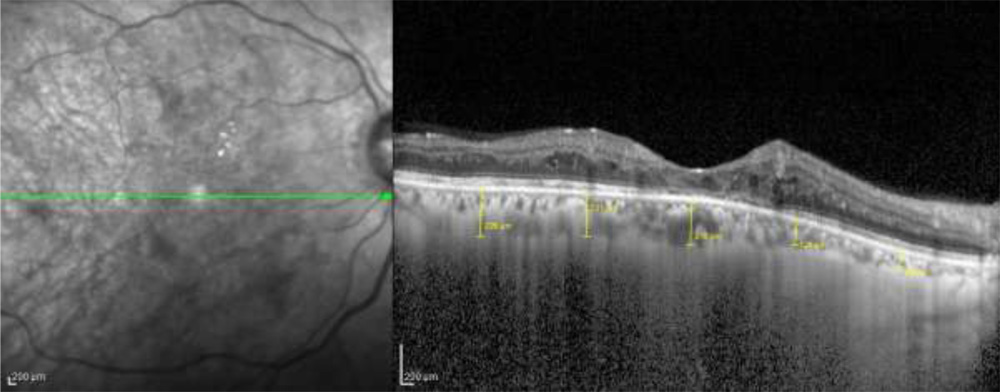
Statistical analysis was performed using the SPSS software, version 16.0. All data were expressed in the form of Mean ± Standard Deviation.Variations in CT, CMT, and other demographic variables between the groups were performed using the independent sample t test. Changes in CT in relation to renal parameters and HbA1C levels in stages of DR were analyzed using the Pearsons’ correlation coefficient. A p-value of less than 0.05 was considered to be statistically significant.
Results
Out of 114 eyes 62 belonged to NPDR and 52 to the PDR group. 63 were females (42%) and 87 were males (58%). The mean age was 57.63 ± 7.97 years.
There was no significant difference in renal parameters (Serum creatinine and Blood urea), serum HbA1C levels, choroidal thickness between the NPDR and PDR group (Table 1). However, the CMT was significantly more in NPDR group (353.40 ± 137.22 µm) as compared to PDR group (305.02 ± 100.32 µm) (Table 1).
Table 1 – Difference in hematological parameters, choroidal thickness and central macular thickness between the two groups
| PDR | NPDR |
P value |
|||
|
Mean |
SD |
Mean |
SD |
||
|
Creatinine HBA1C CMT SFCT CT(1500µ)N CT(1500µ)T CT(3000µ)N CT(3000µ)T Urea
|
1.13 9.06 305.02 257.44 232.35 248.23 181.94 237.60 31.03 |
0.47 1.69 100.32 82.68 86.61 76.76 68.75 84.98 11.14 |
1.09 9.58 353.40 262.55 235.15 249.02 174 231.40 30.70 |
0.28 2.56 137.22 90.37 81.28 99.71 75.38 94.10 8.35 |
0.57 0.21 0.03 0.75 0.85 0.96 0.56 0.71 0.88 |
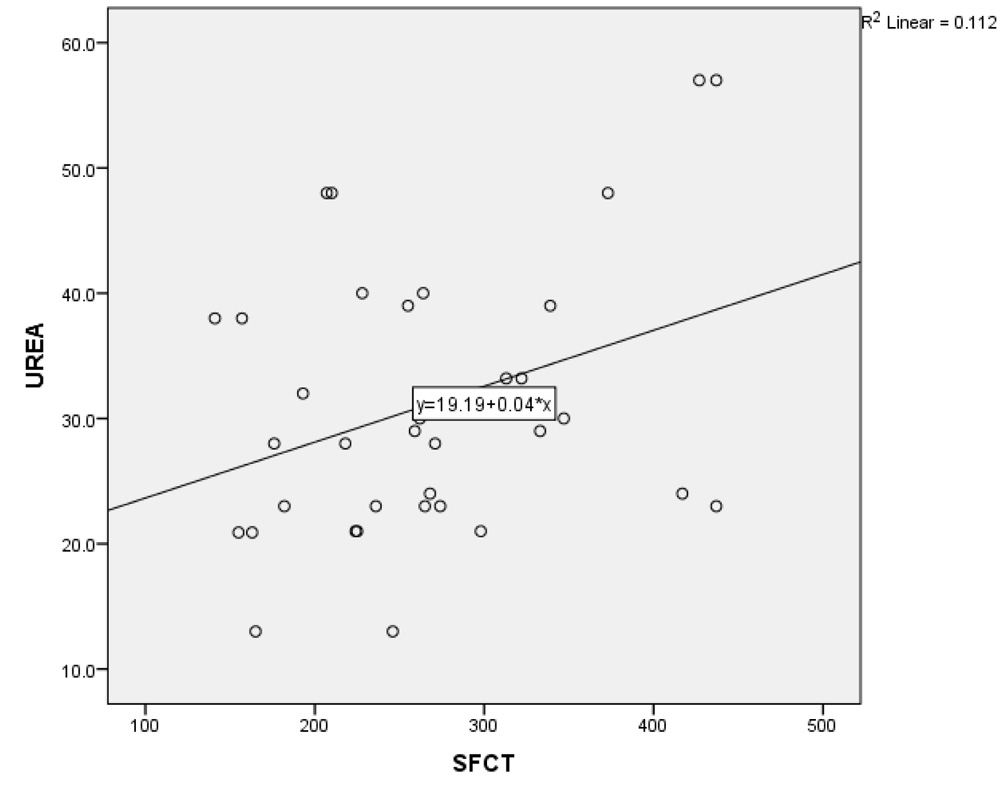
In NPDR group, there was no significant correlation between CT and creatinine (p = 0.2), urea (p = 0.17) and HbA1C levels (p = 0.71). However, in the PDR group, there was significant positive correlation between increasing levels of both creatinine & urea with SFCT (p=0.01 & p=0.04 respectively). (Table 2 and 3; Graph 1 and 2), while no correlation existed with HbA1C levels.
Table 2 – Correlation between the serum creatinine levels with choroidal thickness and central macular thickness (CMT) in PDR group
|
Variables |
Correlation Coefficient |
P Value |
|
CMT CT (1500µ) N CT (1500µ) T CT (3000µ) N CT (3000µ) T SFCT
|
-0.05 0.34 0.29 0.22 0.07 0.34 |
0.70 0.01 0.03 0.10 0.59 0.01 |
Graph 1: Correlation between changes in subfoveal choroidal thickness with creatinine levels in PDR group
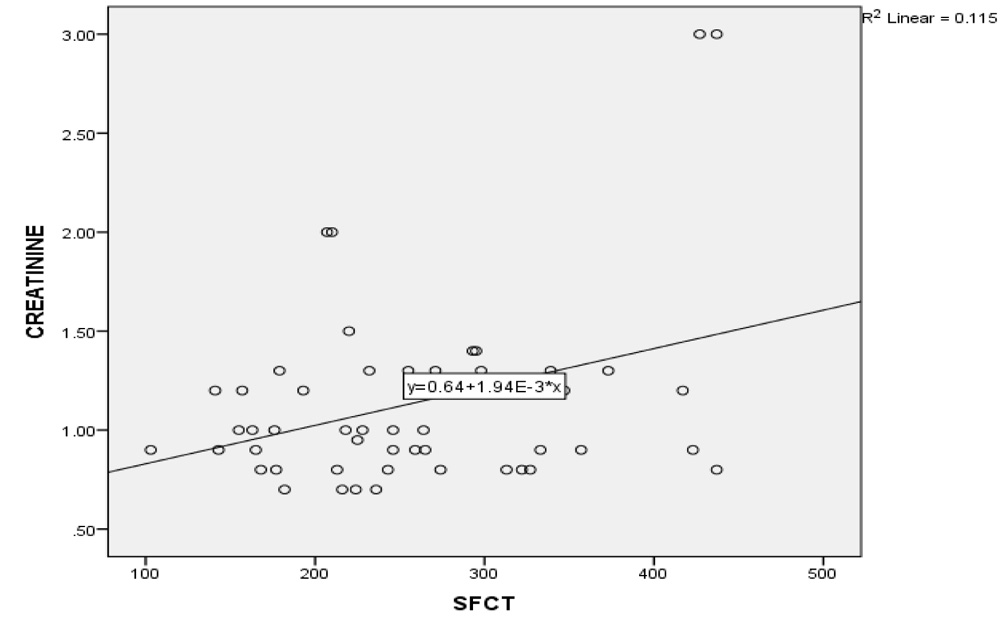
Table 3 – Correlation between the blood urea levels with choroidal thickness and central macular thickness (CMT) in PDR group
|
Variables |
Correlation Coefficient |
P Value |
|
CMT CT (1500µ) N CT (1500µ) T CT (3000µ) N CT (3000µ) T SFCT
|
0.23 0.41 0.33 0.43 0.17 0.33 |
0.17 0.01 0.04 0.01 0.31 0.04 |
Graph 2: Correlation between changes in subfoveal choroidal thickness with blood urea levels in PDR group
In both NPDR and PDR groups, no correlation existed between the CMT and hematological parameters (HbA1C, creatinine and urea levels)
Discussion
Choroid is the principal vascular layer of the eye, receiving approximately 95% ocular blood flow. It principally supplies the outer retinal layers, including the photoreceptors and the retinal pigment epithelium (RPE). Consequently, the foveal region, which consists of only outer retinal layers, predominantly has choroidal blood supply. Macular choroidal thickness can thus be considered as a putative measure of choroidal blood flow and consequently a marker of tissue oxygenation.With the advent of enhanceddepth imaging (EDI) mode and swept-source optical coherence tomography (SS-OCT), it is now possible to visualize and evaluate the entire choroid with remarkable accuracy. One such parameter includes the choroidal thickness (CT).
Many researchers have evaluated changes in CT in various stages of DR with variable results ranging from thickening, thinning,to even no changes as DR progresses from nonproliferative diabetic retinopathy (NPDR) to proliferative diabetic retinopathy (PDR).18–21In our study, we did not find any significant difference in CT between the NPDR and PDR stage.
In our current study, we evaluated changes in choroidal thickness in association with renal parameters (Serum creatinine and Blood urea) and serum HbA1C levels. Although not significant in NPDR eyes, the choroidal thickness increased significantly in relation to renal parameters in PDR eyes. This is a novel finding which has not yet been described in literature. Few authors have evaluated the role of hemodialysis on choroidal thickness in patients with ESKD with variable results. Ulas et al22 showed choroidal thinning in non-diabetic patients while Jung et al have shown choroidal thickening in both diabetic and non-diabetic population.
CT is known to change with various physiological factors such as circadian rhythm,23, 24 perfusion pressure,25 and even has been documented to increase after water drinking test in healthy subjects.26 This occurs due to transient reduction in colloidal osmotic pressure thereby causing extravasation of fluid in choroidal interstitium.27 This causes choroidal engorgement and hence increased choroidal thickness. 27 However, in healthy subjects, these changes are transient because the choroidal and systemic autoregulatory mechanism takes over and restores the normal physiological parameters.
Diabetes is long known to be a microangiopathic disease. The three primary organs to get involved includes the eye (especially retina and choroid), kidney and autonomic system. In our current study, the choroidal thickness was not affected by renal parameters in NPDR group. This is indirectly suggestive of reasonably good functionality of the renal and autonomic system. In contrast, there was significant positive correlation between the choroidal thickness and both creatinine and urea levels. This implies that with rising levels of creatinine and urea levels, there is simultaneous increase in choroidal thickness. This has two major systemic implications. One, it indicates that concomitant renal dysfunction has greater effect in PDR stage as compared to NPDR as reflected by increasing CT with rising creatinine & urea level. This is presumably due to systemic fluid accumulation & secondary ocular hemodynamic changes. Secondly, it is also suggestive of coexisting autoregulatory dysfunction. In normal patients, the autonomic system, especially which controls the choroidal vasculature, is activated in periods of systemic vascular overload. This system becomes operational and reinstates the normal hemodynamics. If there is any plausible autonomic dysfunction coinciding with renal dysfunction, such as in diabetics, the choroidal vasculature fails to regain normal physiology. Such enduring changes may lead to secondary choroidal thickening.
The strengths of our study include its adequate sample size. In addition, all patients in the two groups were treatment naive, which helped to eliminate any confounding role of laser photocoagulation and anti-VEGF therapy. Moreover, it is a singular study to evaluate complex interplay between choroidal thickness and renal parameters in diabetic retinopathy. Likewise, the choroidal thickness was measured at five locations encompassing the entire macula in order to gain better understanding and compelling outcomes of its correlation to renal parameters.
Our study has few potential limitations such as it being primarily cross-sectional in nature. Second, CT was calculated manually by a single masked observer.Ho et al28have compared inter-observer variability in measurements of CT in 36 eyes and found good reproducibility between them. Moreover, manual measurement of CT has been found to be repeatable and reproducible by various studies.29Third, CT was assessed on only horizontal line scan as against on choroidal volumetric analysis.However, Gerendas et al30evaluated 38 eyes of 21 patients on SS-OCT by comparing CT on horizontal line scans against cube scan for volumetric analysis. They found no significant difference between CT measurements between the two and concluded that horizontal line scan measurements are depictive of corresponding ETDRS sub-field analysis on cube scans. Similarly, in our study too, we have performed CT analysis in not only subfoveal region but also nasally and temporally, which can be considered as a substitute for the more tedious and time-consuming volume scans that are also associated with significant blink artifacts. So despite the limitations, the aforementioned studies indicate that data analyzed by a single masked observer on horizontal line scans were acceptable to draw the necessary conclusion of our study.
In conclusion, this study demonstrates that in diabetic retinopathy, concomitant renal dysfunction has greater effect in PDR stage as compared to NPDR as reflected by increasing CT with rising creatinine & urea level possibly due to systemic fluid accumulation & secondary ocular hemodynamic changes besides choroidal autoregulatory dysfunction.
References
- Ciulla TA, Harris A, Latkany P, et al. Ocular perfusion abnormalities in diabetes. ActaOphthalmol Scand. 2002;80:468–477.
- Ciulla TA, Amador AG, Zinman B. Diabetic retinopathy and diabetic macular edema: pathophysiology, screening, and novel therapies. Diabetes Care. 2003;26:2653–2664.
- Schmetterer L, Wolzt M. Ocular blood flow and associated functional deviations in diabetic retinopathy. 1999;42:387–405.
- Hidayat A, Fine B. Diabetic choroidopathy: light and electron microscopic observations of seven cases. Ophthalmology 1985;67:512–522.
- Kur J, Newman EA, Chan-Ling T. Cellular and physiological mechanisms underlying blood flow regulation in the retina and choroid in health and disease. ProgRetin Eye Res. 2012; 31(5):377– 406
- Shiragami C, Shiraga F, Matsuo T, Tsuchida Y, Ohtsuki H. Risk factors for diabetic choroidopathy in patients with diabetic retinopathy. Graefes Arch ClinExpOphthalmol. 2002; 240(6):436–442
- Fukushima I, McLeod DS, Lutty GA. Intrachoroidal microvascular abnormality: a previously unrecognized form of choroidal neovascularization. Am J Ophthalmol. 1997; 124(4):473–487
- Yeoh J, Rahman W, Chen F, et al. Choroidal imaging in inherited retinal disease using the technique of enhanced depth imaging optical coherence tomography. Graefes Arch ClinExpOphthalmol. 2010; 248(12):1719–1728
- Vujosevic S, Martini F, Cavarzeran F, Pilotto E, MidenaE.Macular and peripapillarychoroidal thickness in diabetic patients. Retina 2012;32(9):1781-90.
- Querques G, Lattanzio R, Querques L, Del Turco C, Forte R, Pierro L, et al. Enhanced depthimaging optical coherence tomography in type 2 diabetes.InvestOphthalmol Vis Sci 2012;53:6017–24.
- Xu J, Xu L, Du KF, Shao L, Chen CX, Zhou JQ, et al. Subfovealchoroidal thickness in diabetes and diabetic retinopathy. Ophthalmology 2013;120(10):2023-8.
- Kim JT, Lee DH, Joe SG, Kim JG, Yoon YH.Changes in choroidal thickness in relation to the severity of retinopathy and macular edema in type 2 diabetic patients. Invest Ophthalmol Vis Sci 2013;54(5):3378-84
- Laatikainen L, Summanen P, Ekstrand A, Groop L. Ophthalmological follow-up of diabetic patients after kidney transplantation.Ger J Ophthalmol. 1993;2:24–27.
- Ramsay RC, Knobloch WH, Barbosa JJ, et al. The visual status of diabetic patients after renal transplantation. Am J Ophthalmol. 1979;87:305–310.
- Jung JW, Chin HS, Lee DH, Yoon MH, Kim NR. Changes In subfoveal choroidal thickness and choroidal extravascular density by spectral domain optical coherence tomography after haemodialysis: a pilot study. Br J Ophthalmol. 2014;98:207–212.
- AkihiroIshibazawa, TaijiNagaoka,Yoshiro Minami, et al. Choroidal Thickness Evaluation Before and After Hemodialysis in Patients With and Without Diabetes. IOVS 2015;56:6534-41
- ETDRS research group. Classification of diabeticretinopathy from fluorescein angiograms. ETDRS reportnumber 11. Ophthalmology 1991;98(Suppl):807–822.
- Vujosevic S, Martini F, Cavarzeran F, Pilotto E, MidenaE.Macular and peripapillary choroidal thickness in diabetic patients. Retina 2012;32(9):1781-90.
- Querques G, Lattanzio R, Querques L, Del Turco C, Forte R, Pierro L, et al. Enhanced depthimaging optical coherence tomography in type 2 diabetes.InvestOphthalmol Vis Sci 2012;53:6017–24.
- Xu J, Xu L, Du KF, Shao L, Chen CX, Zhou JQ, et al. Subfoveal choroidal thickness in diabetes and diabetic retinopathy. Ophthalmology 2013;120(10):2023-8.
- Kim JT, Lee DH, Joe SG, Kim JG, Yoon YH.Changes in choroidal thickness in relation to the severity of retinopathy and macular edema in type 2 diabetic patients. Invest Ophthalmol Vis Sci 2013;54(5):3378-84.
- Ulas F, Dogan U, Keles A, Ertilav M, Tekce H, Celebi S. Evaluation of choroidal and retinal thickness measurements using optical coherence tomography in non-diabetic haemodialysis patients. IntOphthalmol. 2013;33:533–539.
- Tan CS, Ouyang Y, Ruiz H, Sadda SR. Diurnal variation of choroidal thickness in normal, healthy subjects measured by spectral domain optical coherence tomography. Invest Ophthalmol Vis Sci. 2012;53:261–266.
- Usui S, Ikuno Y, Akiba M, et al. Circadian changes in subfoveal choroidal thickness and the relationship with circulatory factors in healthy subjects. Invest Ophthalmol Vis Sci. 2012; 53:2300–2307.
- Langham ME, Grebe R, Hopkins S, Marcus S, Sebag M. Choroidal blood flow in diabetic retinopathy. Exp Eye Res. 1991;52:167–173.
- Mansouri K, Medeiros FA, Marchase N, Tatham AJ, Auerbach D, Weinreb RN. Assessment of choroidal thickness and volume during the water drinking test by swept-source optical coherence tomography. Ophthalmology. 2013;120:2508–2516.
- Fauchald P. Transcapillary colloid osmotic gradient and body fluid volumes in renal failure. Kidney Int. 1986;29:895–900.
- Ho J1, Branchini L, Regatieri C, Krishnan C, Fujimoto JG, Duker JS. Analysis of normal peripapillarychoroidal thickness via spectral domain opticalcoherence tomography. Ophthalmology 2011;118:2001–7.
- Yamashita T1, Yamashita T, Shirasawa M, Arimura N, Terasaki H, Sakamoto T. Repeatability and reproducibility of subfoveal choroidal thickness in normal eyes of Japanese using different SD-OCT devices. Invest Ophthalmol Vis Sci 2012;53:1102–7.
- Gerendas BS, Hecht A, Kundi M, Waldstein SM, Deak G, Simader C, et al. Choroidal Line Scan Measurements in Swept-Source Optical Coherence Tomography as Surrogates for Volumetric Thickness Assessment. Am J Ophthalmol 2015 Nov 3.pii: S0002-9394(15)00675-3.