Dr. Nabanita Barua, B13505, Dr. Sonu Goel, Dr. Chitra Sitaraman, Dr. Sonai Mukherjee
ANALYSIS OF MACULAR GANGLION CELL COMPLEX AND RETINAL NERVE FIBRE LAYER IN PRIMARY OPEN ANGLE GLAUCOMA, OCULAR HYPERTENSION AND NORMAL POPULATION
INTRODUCTION :
Glaucoma, by definition, is a multi-factorial optic neuropathy characterized by a loss ofretinal ganglion cells with subsequent loss of the retinal nerve fibers ultimately resulting in visual impairment. In the macula, the Retinal ganglion cell complex (RGC) layer is >1 cell layer thick with an RGC body diameter 10 to 20 times larger compared with their axons. Optical coherence tomography provides objective, quantitative, reproducible measurements of the retina and RNFL thickness, direct measurements of the RNFL are calculated from cross sectional retinal images at pre-perimetric stage. Retinal nerve fiber layer loss and their functional correlationis well documented in literature. In pre-perimetric stage 20 micron loss of retinal nerve fiber layer is suggestive of progression. Taking retinal nerve fiber layer loss on OCT as consistent measurement, the study aimed at finding whether ganglion cell complex is the earlier indicator of development of glaucoma. The inclusion of established glaucoma patients and their functional and structural correlation provided the basis for comparison of extent of loss documented by RNFL and GCC. Study of ocular hypertensive versus normal population provided the basis of comparison of earlier predictability of GCC versus RNFL in preperimetric glaucoma.
MATERIAL AND METHOD:
The study was approved by our institutional review board and complied with tenets of the declaration of Helsinski. Patients provided written informed consent.
PRIMARY OPEN ANGLE GLAUCOMA
INCLUSION CRITERIA:
Patient of Primary Open Angle Glaucoma and fulfilling the following criteria were included.
(1) Changes in the optic disc that is suggestive of progressive glaucomatous damage(diffuse or localized rim thinning and disc hemorrhage, notch, bayonetting, baring or vertical cup-to-disc ratio greater than 0.3 or difference in cup disc ratio of more than 0.2 in the 2 eyes, in absence of significant difference in disc size)
(2) Presence of glaucomatous visual field defects that corresponded with the Retinal Nerve Fibre Layer( RNFL) defects and optic nerve head abnormalities
(3) Gonioscopically open angles
EXCLUSION CRITERIA:
(1) Any Secondary glaucomas in the form of uveitic glaucoma, neo vascular glaucoma, lenticular, pigmentary and pseudo exfoliation glaucoma, vitreo retinal disease
(2) History of accelerated hypertension, coronary artery disease, diabetes and any past cerebrovascular accident
(3) Best-corrected visual acuity worsethan 6/60
(4) Retinal pathology
(5) Presence of significant cataract
OCULAR HYPERTENSION(OHT)
INCLUSION CRITERIA
(1) Open angle
(2) IOP >21 mm Hg byApplanation Tonometry (corrected for central corneal thickness)
(3) Absence of visual field defect
EXCLUSION CRITERIA
(1) BCVA less than 6/6
(2) Macular pathology
(3) Diabetes, uncontrolled hypertension
NORMAL POPULATION
INCLUSION CRITERIA
(1) Intraocular pressure of less than 21 mmHg
(2) A normal appearing optic disc head, no RNFL defect in red free fundus photography
(3) Normal Static Automated Perimetry(SAP) result
EXCLUSION CRITERIA
(1) History of chronic ocular disease of volunteers
(2) Systemic diseases that might have affected the eyes and systemic corticosteroid use.
These volunteers should have undergone the same comprehensive ophthalmic examination and OCT.
CLINICAL ASSESSMENT:
◘ Review of medical history
◘ best corrected visual acuity (BCVA) with any add on refractive error at presentation
◘ IOP by applanation tonometry
◘ Slit lamp biomicroscopy for anterior segment examination including type of lenticular changes, gonioscopy,
◘ Direct ophthalmoscopy/ disc examination with 90D
◘ Central corneal thickness
◘ Visual field by static perimetry (Humphrey VF 24-2)
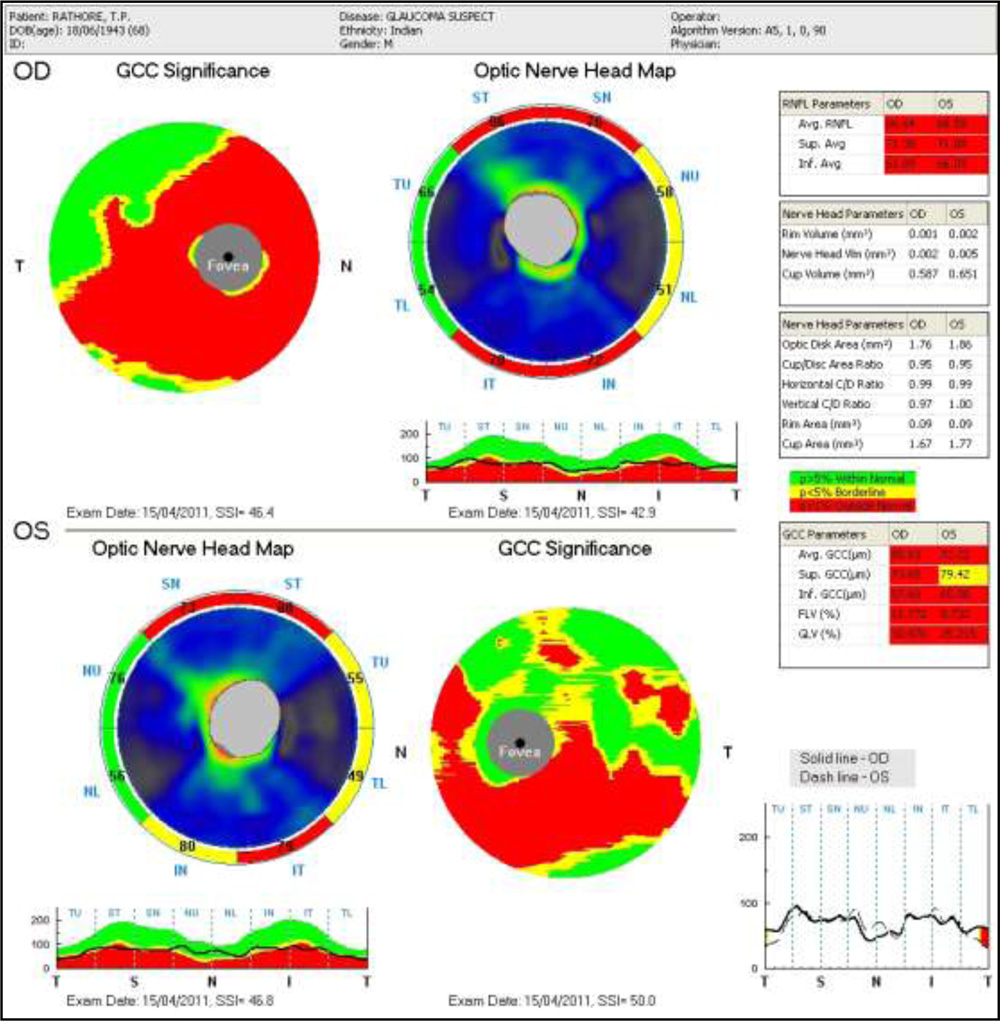
◘ OCT RNFL AND GCC : Ganglion cell complex has 5 parameters: average, superior and inferior, focal and global loss of volume. Retinal nerve fiber layer has 3 parameters: average, superior and inferior. It is a single day cross sectional study with no follow up.
FOLLOW-UP:
Single day cross sectional study.
Prototype patient
The SPSS program was used for statistical analysis (Med Calc software v 12.2.10). An ANOVA test was used to compare the measured parameter values between the patient groups. Sensitivity, specificity for OCT parameters were determined. P-values of 0.05 were considered as statistically significant. One way ANOVA and post hoc Tukey HSD test was applied to look for RNFL thickness, and macular thickness measurement differences between glaucomatous, OHT and healthy eyes. The relationships between mean RNFL/GCC thickness and Mean Deviation (MD) were evaluated with regression analyses. Pearson’s correlation coefficients were used to assess the correlations between continuous variables. Receiver operating characteristic (ROC) curves were used to describe the ability to differentiate glaucomatous and OHT from healthy eyes of each of the FD-OCT
Patients were divided into 5 groups: POAG/normal, POAG/OHT, OHT/normal, EARLY POAG/normal, early POAG/OHT. ROC was calculated for each parameter in each subgroup. The early POAG group were included to detect which parameter was more diagnostic in early cases (MD< 6dB).
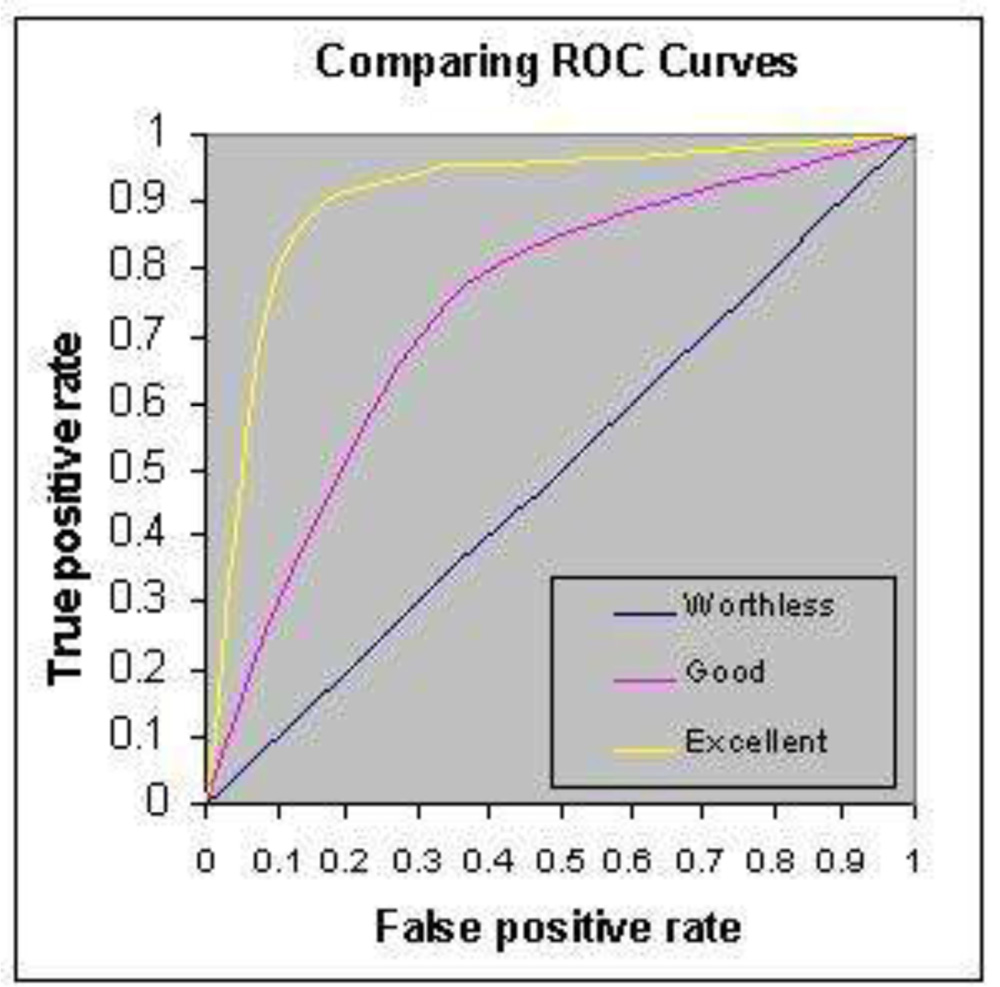
- The graph below shows three ROC curves representing excellent, good, and worthless tests plotted on the same graph. The accuracy of the test depends on how well the test separates the group being tested into those with and without the disease in question. Accuracy is measured by the area under the ROC curve. An area of 1 represents a perfect test; an area of .5 represents a worthless test. A rough guide for classifying the accuracy of a diagnostic test is the traditional system:
- 90-1 = excellent (A)
- .80-.90 = good (B)
- .70-.80 = fair (C)
- .60-.70 = poor (D)
- .50-.60 = fail (F)
RESULTS: It was an age and sex matched population.

Ganglion cell complex and retinal nerve fiber layer is highly significant in POAG versus OHT and normal population (p 0.000, <.0.001). No significant difference in GCC or RNFL in OHT versus control population (p >0.05).
| PARAMETERS | POAG | OHT | CONTROL |
| GCC avg (μ) | 78.19+12.21
(53.05-100.84) |
92.17+ 8.02
(73.51-109.63) |
91.11+5.48
(80.69-112.23) |
| GCC sup (μ) | 80.16+12.01
(53.35-101.01) |
91.64+ 8.11
(76.66-109.05) |
90.67+5.41
(80.06-111.09) |
| GCC inf(μ) | 77.36+ 13.64 μ
(49.76-100.69) |
93.12+9.05
(69.28-112.79) |
92.03+5.24
(81.33-118.43) |
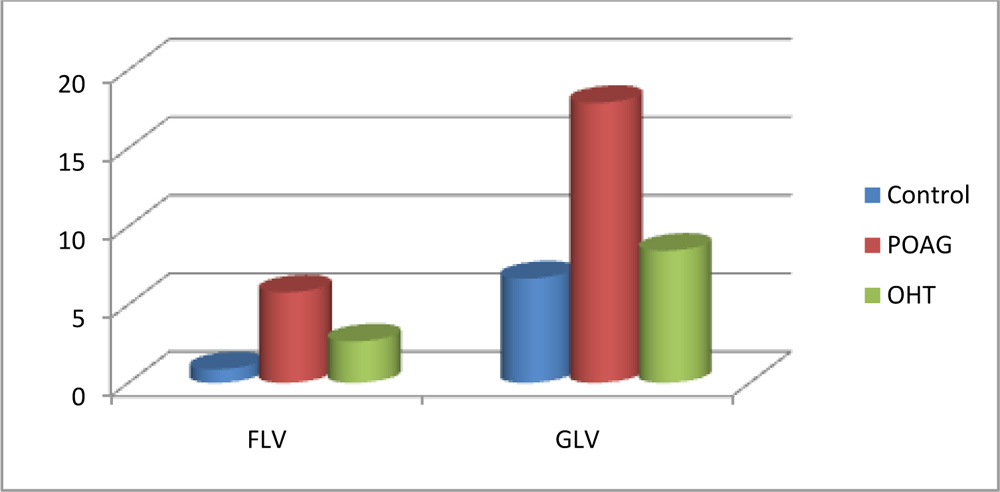
| Focal Loss of Volume (FLV) | 5.77+ 5.28
(.007-24.915) |
2.68+2.96
(0.014-11.16) |
0.85 +.76
(0.004-14.653) |
| Global Loss of Volume (GLV) | 17.89+ 11.76
(.098-44.384) |
8.44 + 6.02
(0.473-26.689) |
6.657+3.56
(1.004-14.653) |

| Parameters | POAG | OHT | Controls |
| Average RNFL | 83.24+17.86
(53.35 -122.5) |
99.52+12.56
(73.4-132.41) |
103.12+ 9.32
(71.77-130.5) |
| Superior RNFL | 87.32+18.32
(53.34-126.5) |
98.56+16.47
(70.66-160.92) |
101.39 + 9.84
72.78-130.630 |
| Inferior RNFL | 86.68+ 2.12
(47.76-124.640) |
100.40+13.36
(67.85-131.48)) |
103.4+11.14
(86.68-132.5) |

All parameters shows strong correlation with Mean deviation
| GCC avg | GCC sup | GCC inf | FLV | GLV | RNFL avg | RNFL
sup |
RNFL
Inf |
|
| r | -0.566 | -0.552 | -0.57 | 0.551 | 0.604 | -0.504 | -0.41 | -0.535 |
| P | 0.00 | 0.00 | 0.00 | 0.00 | 0.00 | 0.00 | 0.00 | 0.00 |
POAG/ control: .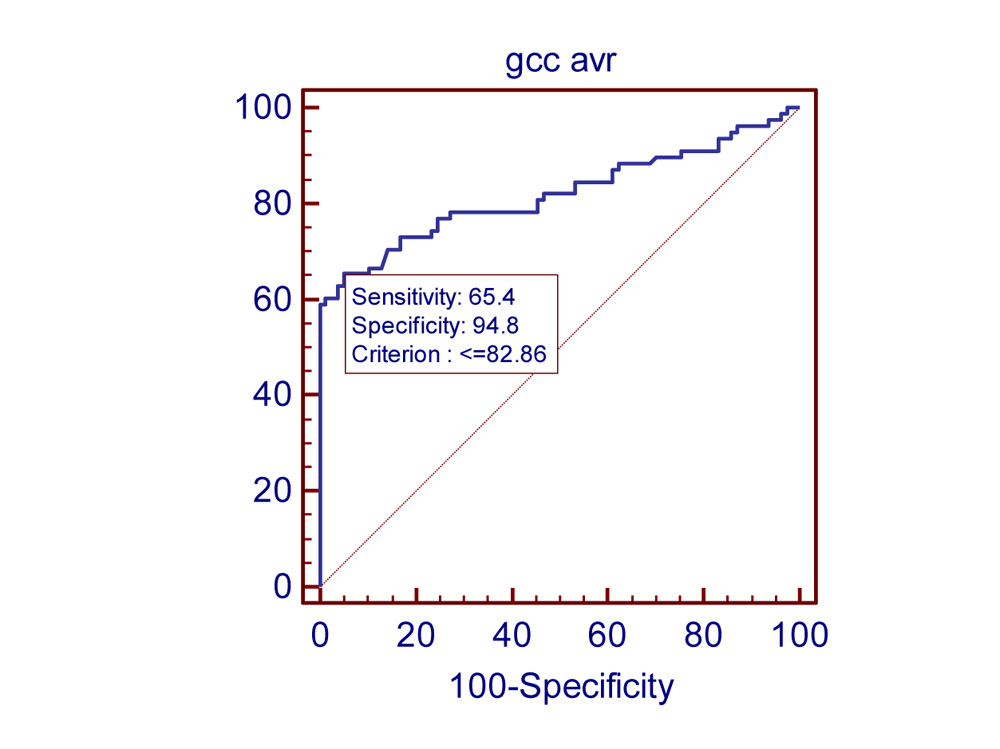
the study finding: Area for GCC average .820 with 95 % confidence limit is from .750 to .877 . With cut off of value of 82.66 sensitivity and specificity is maximum: 65% sensitivity and 94.8% specific
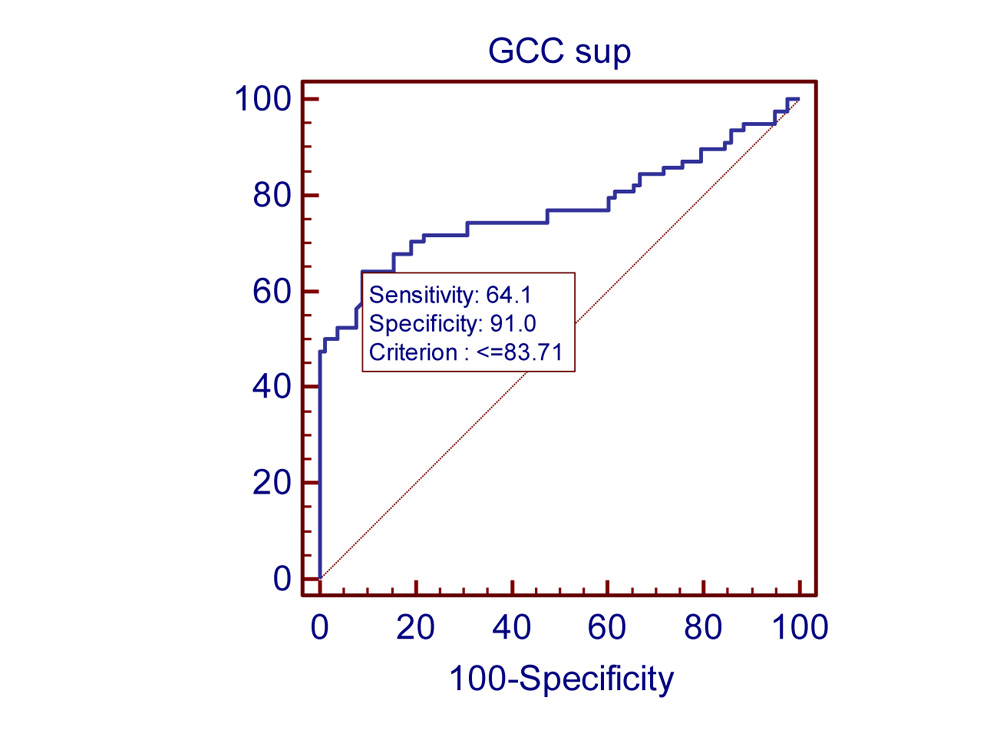
AUC for GCC superior average the area under the ROC (AROC) curve for sup average is .774. 95 % confidence limit is .700- .837. With cut off limit of 83.71, sensitivity is 64.1% specificity is 91.0%.
AUC for GCC inferior average the area under the ROC (AROC) curve for average GCC was .827. 95% confidence limit is from 0.758-0.883. With cut off value of 84.41 sensitivity is 67% and specificity is 84.41%.
Area under ROC for FLV is .791. CI of 95% is .718-0.852. With cut off value of 2.035 sensitivity is 67.9% specificity is 94.9%. AUC of GLV: Area under ROC is 0.796. CI of 95% is 0.724-0.857.With cut off value of 12.499 sensitivity is 64.9% and specificity is 98.7%.Area under ROC for average RNFL is .821. CI of 95% is .752-0.878. With cut off value of 93.49 sensitivity is 76.6% specificity is 84.6%. Area under ROC for superior RNFL is .763. CI of 95% is .688-0.828. With cut off value of 90.03 sensitivity is 64.9% specificity is 87.2%. Area under ROC for inferior RNFL is .816. CI of 95% is .746-0.874. With cut off value of 91.79 sensitivity is 67.9% specificity is 89.7%.
In POAG/OHT population also inferior GCC had highest AUC (.825)
In OHT/normal population none of the parameters were statistically significant.
In early POAG/OHT and Early POAG/normal population only Inferior GCC had statistically significant AUC value (.715). Rest all parameters didn’t have statistically significant AUC .
DISCUSSION:
Observation of Kim et al closely resembles documenting equal diagnostic capability of ganglion cell complex with retinal nerve fibre layer. In their study also Inferior GCC showed highest AUC but difference was not statistically significant.
Ishikawa et aldeveloped a macular segmentation algorithm to measure sublayer thickness for glaucoma diagnosis: they showed that macular inner retinal complex (ganglion cell layer, inner plexiform layer, inner nuclear layer) was thinner in eyes with perimetric glaucoma.
Leung et alused the Stratus TD-OCT (Carl Zeiss, Dublin, CA) to evaluate macular nerve fibre layer thinning in glaucoma. They reported a reduction in macular nerve fibre layer thickness in glaucomatous eyes compared with normal eyes. Schulze et alobservation was similar. Glaucoma patients showed a significant reduction in GCC and macular retinal thickness compared to patients with OHT and normal subjects. No differences in GCC were found between the patients with OHT and normal subjects.This also resembles outcomes of Teresa Roll,they concluded AUCs didn’t significantly differ in macular and peripapillary RNFL values. The study finding are similar to Schulze et al. No differences were found between patients with OHT and normal subjects with regard to ONH, RNFL and GCC parameters.
The study concluded GCC and RNFL showed equal predictive capability to differentiate POAG from normal, Inferior GCC having highest predictive value. GCC and RNFL showed equal predictive capability, Inferior GCC had highest area under curve. Inferior GCC was the best parameter to differentiate early glaucoma (MD<-6dB) from normal and glaucoma from OHT population/ pre-perimetric population.
Reference:
- Kim JS, Ishikawa H, Sung KR, et al. Retinal nerve fiber layer thickness measurement reproducibility improved with spectral domain optical coherence tomography. Br J Ophthalmol. 2009;93:1057–1063.
- Meideros FA, Zangwill LM, Bowd C, et al. Influence of disease severity and optic disc size on the diagnostic performance of imaging instruments in glaucoma. Invest Ophthalmol Vis Sci. 2006;47:1008–1015
- Teresa Rolle, Cristina Briamonte, Daniela Curto, Federico Maria Grignolo. Clinical Ophthalmology 2011:5 961–969
- Mauro , Harsha L. Rao, MD,1,3 Linda M. Zangwill, PhD,1 Robert N. Weinre,1Felipe A. Medeiro. Ophthalmology 2011;118:1334–1339
- Graefes Arch Clin Exp Ophthalmol. 2011 Jul;249(7):1039-45. Epub 2011 Jan 15.
- Diagnostic ability of retinal ganglion cell complex, retinal nerve fiber layer, and optic nerve 78 a. head measurements by Fourier-domain optical coherence tomography.
- Schulze A, Lamparter J, Pfeiffer N, Berisha F, Schmidtmann I, Hoffmann EM. Eye (Lond). 2011 Feb;25(2):224-32. Epub 2010 Dec 24.
- Soliman MA, Van Den Berg TJ, Ismaeil AA, et al. Retinal nerve fiber layer analysis: relationship between optical coherence tomography and red-free photography. Am J Ophthalmol 2002;133:187–95.
- Parisi V, Manni G, Centofanti M, et al. Correlation between optical coherence tomography, pattern electroretinogram, and visual evoked potentials in open-angle glaucoma patients. Ophthalmology 2001;108:905–12.
- El Beltagi TA, Bowd C, Boden C, et al. Retinal nerve fiber layer thickness measured with optical coherence tomography is related to visual function in glaucomatous eyes. Ophthalmology 2003;110:2185–91
- Ishikawa H, Stein DM, Woolstein G, et al. Macular segmentation with optical coherence tomography. Invest Ophthalmol Vis Sci. 2005;46:2012–2017.
- Greenfield DS, Bagga H, Knighton RW, et al. Macular thickness changes in glaucomatous optic neuropathy detected using optical coherence tomography. Arch Ophthalmol. 2003;121:41–46.
- Tan O, Chopra V, Lu A, et al. Detection of macular ganglion cell loss in glaucoma by fourier domain optical coherence tomography.Ophthalmology.2009;116:2305–2314
- Lederer DE, Schuman JS, Hertzmark E, et al. Analysis of macular volume in normal and glaucomatous eyes using optical coherence tomography. Am J Ophthalmol 2003;135: 838 – 43.
- Tanito M, Itai N, Ohira A, Chihara E. Reduction of posterior pole retinal thickness in glaucoma detected using the Retinal Thickness Analyzer. Ophthalmology 2004;111:265–75
- Eur J Ophthalmol. 2012 Mar 20:0. doi: 10.5301/ejo.5000131. Fourier domain OCT measurement of macular, macular ganglion cell complex, and peripapillary RNFL thickness in glaucomatous Chinese eyes. Chen J, Huang H, Wang M, Sun X, Qian S
- Effect of spectrum bias on the diagnostic accuracy of spectral-domain optical coherence tomography in glaucoma. Rao HL, Kumbar T, Addepalli UK, Bharti N, Senthil S, Choudhari NS, Garudadri CS : invest Ophthalmol Vis Sci. 2012 Feb 29;53(2):1058-65. Print 2012 Feb.
- Retinal nerve fiber layer and macular inner retina measurements by spectral domain optical coherence tomography in Indian eyes with early glaucoma. Rao HL, Babu JG, Addepalli UK, Senthil S, Garudadri CS. Invest opth .
- Influence of optic disc size on the diagnostic performance of macular ganglion cell complex and peripapillary retinal nerve fiber layer analyses in glaucoma. Cordeiro DV, Lima VC, Castro DP, Castro LC, Pacheco MA, Lee JM, Dimantas MI, Prata TS. Clin Ophthalmol. 2011;5:1333-7. Epub 2011 Oct 19
- Graefes Arch Clin Exp Ophthalmol. 2011 Jul;249(7):1039-45. Epub 2011 Jan 15. Diagnostic ability of retinal ganglion cell complex, retinal nerve fiber layer, and optic nerve head measurements by Fourier-domain optical coherence tomography. Schulze A, Lamparter J, Pfeiffer N, Berisha F, Schmidtmann I, Hoffmann EM. Eye (Lond). 2011 Feb;25(2):224-32. Epub 2010 Dec 24.
- Pattern electroretinogram association with spectral domain-OCT structural measurements in glaucoma. Bowd C, Tafreshi A, Zangwill LM, Medeiros FA, Sample PA, Weinreb RN
- Diagnostic capability of Fourier-Domain optical coherence tomography in early primary open angle glaucoma. Fang Y, Pan YZ, Li M, Qiao RH, Cai Y. Chin Med J (Engl). 2010 Aug 5;123(15):2045-5
- Br J Ophthalmol. 2011 Aug;95(8):1115-21. Epub 2010 Aug 30. Comparing the ganglion cell complex and retinal nerve fibre layer measurements by Fourier domain OCT to detect glaucoma in high myopia. Kim NR, Lee ES, Seong GJ, Kang SY, Kim JH, Hong S, Kim CY.
- Invest Ophthalmol Vis Sci. 2010 Dec;51(12):6401-7. Epub 2010 Jul 14. Relationship between visual field sensitivity and macular ganglion cell complex thickness as measured by spectral-domain optical coherence tomography. Cho JW, Sung KR, Lee S, Yun SC, Kang SY, Choi J, Na JH, Lee Y, Kook MS
- Invest Ophthalmol Vis Sci. 2006 May;47(5):2006-10. Diagnostic capability of optical coherence tomography in evaluating the degree of glaucomatous retinal nerve fiber damage. Sihota R, Sony P, Gupta V, Dada T, Singh R.
- Invest Ophthalmol Vis Sci. 2005 Oct;46(10):3702-11. Comparative study of retinal nerve fiber layer measurement by StratusOCT and GDx VCC, II: structure/function regression analysis in glaucoma. Leung CK, Chong KK, Chan WM, Yiu CK, Tso MY, Woo J, Tsang MK, Tse KK, Yung WH.
- Invest Ophthalmol Vis Sci. 2007 Jan;48(1):258-63. Relationship between visual field sensitivity and retinal nerve fiber layer thickness as measured by optical coherence tomography. Ajtony C, Balla Z, Somoskeoy S, Kovacs B
- Jpn J Ophthalmol. 2007 May-Jun;51(3):197-203. Measurement of retinal nerve fiber layer thickness and macular volume for glaucoma detection using optical coherence tomography. Ojima T, Tanabe T, Hangai M, Yu S, Morishita S, Yoshimura N.
- Ophthalmology 2010 Feb;117(2):267-74. Retinal nerve fiber layer imaging with spectral-domain optical coherence tomography a study on diagnostic agreement with Heidelberg Retinal Tomograph. Leung CK, Ye C, Weinreb RN, Cheung CY, Qiu Q, Liu S, Xu G, Lam DS.