 FP1090 : Residual Effects of Anti Glaucoma Medication on Corneal Stiffness in Primary Open Angle Glaucoma
![]()
AIOS – D. B Chandra Disha Award
Dr. Sushma Tejwani, T07254, Dr. Rohit Shetty, Dr. Shoruba, Dr. Abhijit Sinha Roy
Sushma Tejwani1, MD; ShorubaDinakaran1, MD; Rohit Shetty2, MD, FRCS, PhD; Abhijit Sinha Roy3, PhD
1 Glaucoma Department, Narayana Nethralaya, Bangalore, India;
2 Vice-Chairman, Narayana Nethralaya, Bangalore, India;
3 Chief Scientist, Imaging, Biomechanics and Mathematical Modeling Solutions, Narayana Nethralaya, Bangalore, India
Purpose:
We studied whether topical medication in primary open angle glaucoma (POAG) eyes altered the corneal stiffness using air-puff applanation data analyzed using viscoelastic model and inverse Finite element modeling (FEM).
Methods:
A total of 76 POAG eyes on glaucoma medication and 39 normal eyes were analyzed using Corvis-ST (air-puff applanation device) and Pentacam HR (scheimpflug imaging based topographer); devices from OCULUS Optikgerate Gmbh, Germany. Patients were grouped into those using prostaglandin only, beta blocker only and a combination of prostaglandin plus beta blocker. In the combination group only one medication from each type was used. Patients with history of glaucoma surgery or other glaucoma medication use were excluded.
Data analysis method 1: A viscoelastic model was applied to corneal deformation, which performed explicit quantification of corneal stiffness (kc), extra-ocular tissue stiffness (kg) and viscosity (μg) with the assumption of homogenous corneal material property for faster computation.
Data analysis method 2: Inverse FEM assuming non homogenous corneal material property done on the structural data from Pentacam HR and functional data from Corvis-ST.
Statistical Analysis of viscoelastic model parameters was done using multivariate analysis of covariance, intraocular pressure (IOP) and central corneal thickness (CCT) as covariates. A p<0.05 was considered statistically significant. All measurements are reported as mean ± standard error of the mean.Inverse FEM result were interpreted using simulated displacement of the corneal apex for 0 – 60 mmHg of IOP in each group.
Result:
There were 76 patients of POAG on different medication and 39 normals. The details are described in the table1.
Mean kc was 108.92 ± 2.90 N/m, 120.87 ± 6.28 N/m, 124.24 ± 5.51 N/m and 105.45 ± 4.94 N/m in the normal, prostaglandin, beta blocker and combination group
| Parameters | Normal
group (N=39) |
Prostaglandin group (N=25) | Combination group (N=29) | Beta blockers group (N=22) | P value |
| Demographics | |||||
| Age | 61 ± 2 | 62 ± 2 | 60 ± 1 | 66 ± 2 | 0.1 |
| CCT (µm) | 531.03 ± 4.49 | 521.24 ± 4.75 | 523.62 ± 5.79 | 517.73 ± 4.09 | 0.25 |
| IOP (mmHg) | 14.26 ± 0.29 | 16.02 ± 0.62 | 15.48 ± 0.59 | 15.36 ± 0.65 | 0.07 |
| Viscoelastic Model Result | |||||
| Kc (N/m) | 112.1 ± 2.62 | 114.29 ± 3.38 | 120.53 ± 2.97 | 124.36 ± 3.38 | 0.02 |
| Kg (N/m) | 60.17 ± 5.32 | 74.14 ± 6.96 | 74.68 ± 6.92 | 75.17 ± 6.75 | 0.23 |
| µg (Pa.s) | 0.33 ± 0.02 | 0.43 ± 0.03 | 0.4 ± 0.03 | 0.41 ± 0.03 | 0.03 |
Table 1: The demographics and the result of the viscoelastic model based data analysis
Multivariate analyses shows significantly changes with kc (p=0.02) between normal and beta blocker groups [covariance factors IOP (p<0.001) was significant]. Multivariate analyses shows significantly changes with μg (p=0.03) between normal and the prostaglandin group [covariance factors IOP (p=0.02) and CCT (p=0.01) were significant]. kg was found be not changing (p=0.23) in the groups (table 1).
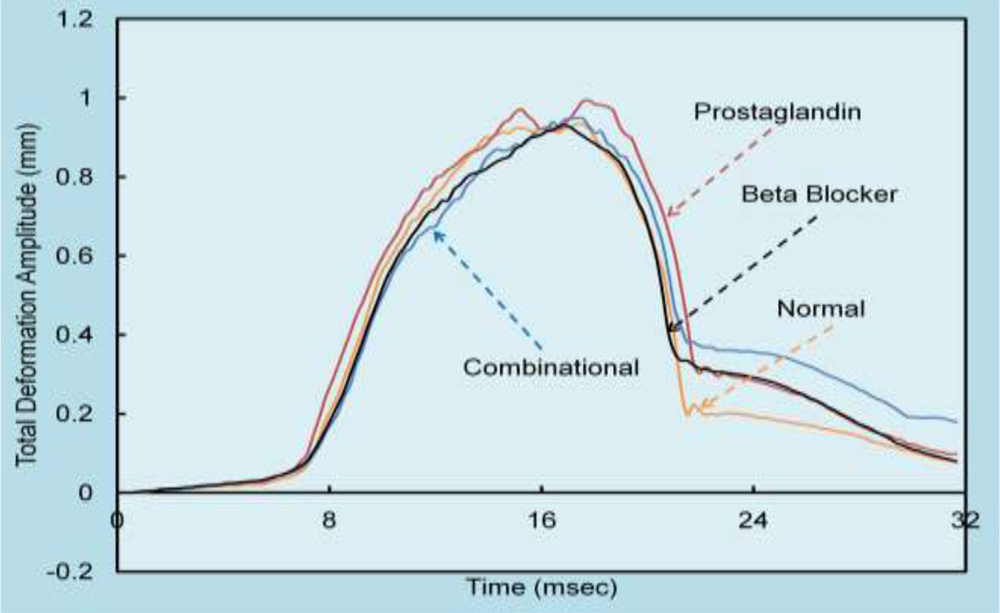
Fig 1: Total deformation amplitude plotted against time for all patients
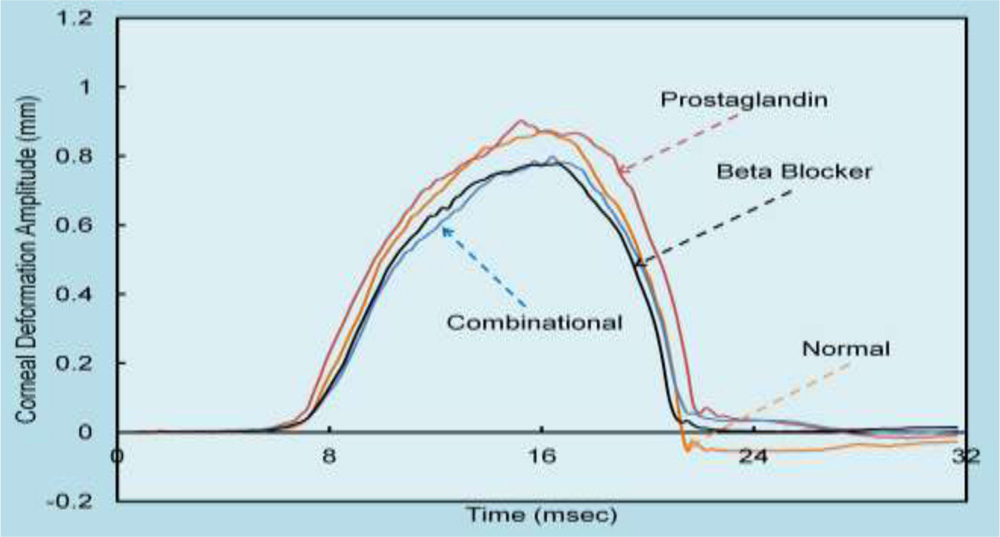
Fig 2: Corneal deformation amplitude plotted against time for all patients
The results of viscoelastic model are shown in fig 1 and 2, where fig 1 refers to the total deformation obtained with time in each group, whereas fig 2 represents only the corneal component of the deformation (Total deformation – Deformation due to extra ocular tissue).
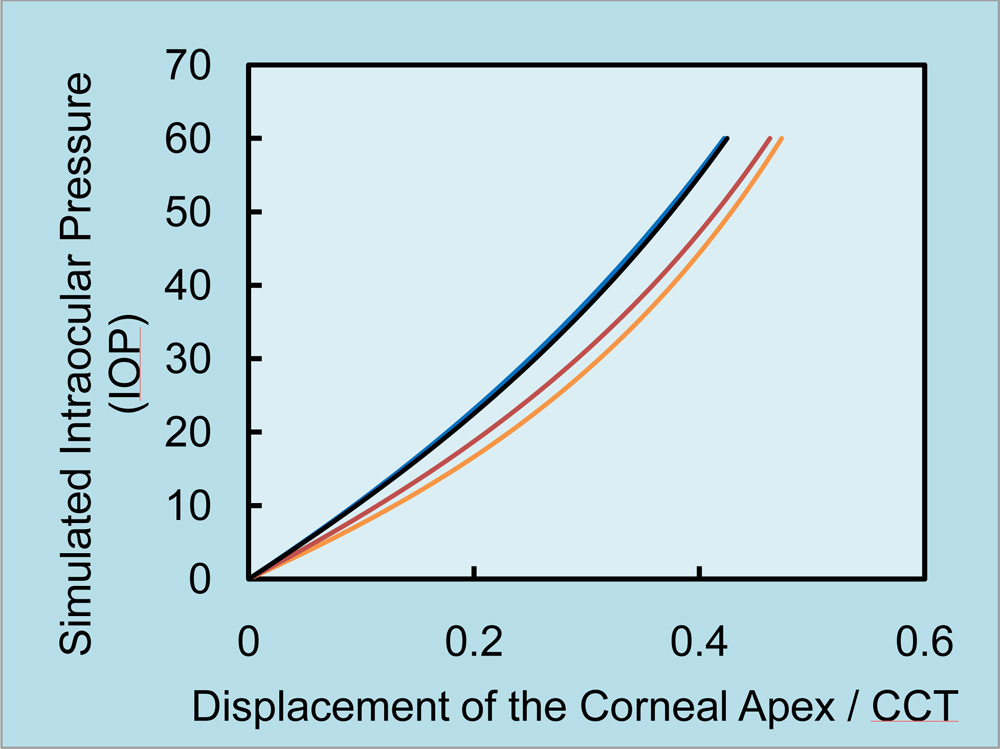
The result of the inverse FEM based simulation of apical displacement for different IOP plotted which follow the trend of the viscoelastic model (figure 3 apical displacement with normalizing CCT). Plot approaching the y-axis is stiffer than the one which is away from the y-axis
Figure 3: Simulated displacement of the corneal Apex (normalized for CCT) with respect to IOP (range of 0 to 60 mmHg)
Conclusions:
The study provided clinical evidence of modulated corneal stiffness and extra-ocular viscosity in treated POAG eyes. However, the reasons behind differential modulation are not fully understood. Further investigation with larger sample size is required.
Acknowledgement:
Narayana Nethralaya Foundation is gratefully acknowledged for their support. OCULUS Optikgerate Gmbh, Germany and Indo-German Science & Technology Centre, India are acknowledged for the project funding.
Reference:
- Sinha Roy A, Kurian M, Matalia H, Shetty R. Air-puff associated quantification of non-linear biomechanical properties of the human cornea in vivo. J Mech Behav Biomed Mater. 2015;48:173-82
- Kaweh Mansouri, Mauro T. Leite, Robert N. Weinreb, Ali Tafreshi, Linda Zangwill, Felipe A. Medeiros. Association between Corneal Biomechanical Properties and Glaucoma Severity. Am J Ophthalmol. 2012 Mar; 153(3)