Dr. Shweta, S16093, Dr. Rajiv Garg
Dr Shweta Chaurasia1, Prof Rajiv Garg 1, , Prof Sarita Beri 1
Corresponding Author:
ShwetaChaurasia
Consultant ASG Eye Hospital,
Strabismology, Pediatric Ophthalmology and Neuro-Ophthalmology Services
Ex-Senior Resident,
Room no 484, 4th floor
Dr R P Centre for Ophthalmic Sciences, AIIMS
Ansari Nagar, New Delhi-110029, India
+919990909575
Abstract
PURPOSE: To assess size of optic cup diameter sonographically in glaucoma & normal population and correlate with their photographic parameters to propose a cut off value as predictive index of glaucoma.
METHODS: 95/50 primary open angle glaucoma and 86/45 control patients with clear media underwent visual fields, fundus photography and B-scan ultrasound. Photographic vertical cup diameter (PVCD) of cases and controls were recorded after magnification correction using Bengtsson formula.Sonographic vertical optic cup diameter (SVCD) was measured in vertical transverse position.
RESULTS:
Mean SVCD was 1.06±0.30 mm in glaucoma and 0.798±0.35 mm in controls (p value 0.001). MeanPVCD was 0.965±0.248mm in glaucoma and 0.650±0.29mm in control (p value 0.001). A significant correlation between PVCD and SVCD in both groups were found (intra-class correlation r=0.85; p value=0.001; glaucoma & r=0.83; p-value=0.001; control). SVCD had positive correlation with Vertical cup disc ratio (r=0.690,p=0.001 glaucoma) & (r=0.756, p value=0.001 control); cup area (r=0.699; p=0.001 glaucoma; r=0.6342, p=0.001 control) and negative correlation with Vertical Neural rim (NRR) (r=-0.5187 p=0.000; glaucoma) &(r=-0.7072, p value=0.001; control)A positive correlation of SVCD was noted with severe field grade changes. NRR area of controls were analysed to determine the lower limit of 95% confidence interval. The value of SVCD lying in that interval in all subjects was 0.9mm, cut off value as a predictive index for glaucoma (63.87%sensitivity and 58.06% specificity)
CONCLUSION:
The sonographic evaluation of optic cup is a reliable non invasive procedure, potentially useful tool in assessment and monitoring of suspected glaucomatous cups.
Key words: Sonographic vertical cup diameter; photographic vertical cup diameter; neuroretinal rim area.
INTRODUCTION
Glaucoma is the second leading cause of blindness globally after cataract1. Glaucoma is an optic neuropathy characterized by a progressive loss of retinal ganglion cells with vertical elongation of the optic cup associated with visual field defects.2-4 When it comes to screening the patient for glaucoma or following up over a period of time, we routinely use ophthalmoscopic documentation of disc size, cup size and cup/disc diameter ratio (CDR) and subsequently consider for visual fields and other tests. But we are clueless when we come across screening glaucoma in patients with opaque media like dense cataract, corneal opacity, and vitreous haemorrhage or when on subsequent follow up, glaucoma patients develop media opacity.New techniques like Heidelberg retinal tomography (HRT)5; optical coherence tomography (OCT)6-7 and scanning laser polarimetry (SLP)8 which are more sensitive and accurate have been developed to objectively and reproducibly evaluate the Optic Nerve Head (ONH)and Nerve Fibre Layer (NFL). But these are expensive, sophisticated and not available at all centresin developing nations. And most importantly all these new modalities fail to work in opaque media.
Sonography is a useful tool with the advantage of evaluating posterior segment including optic disc cupping in patients with opaque ocular media.9 It’s easy availability and affordability in institutions adds more to this advantage. Though role of ultrasonography in the assessment of the optic cup has been previously investigated but only few studies are present in literature which have tested its reliability in picking up glaucomatous cup.
Previous studies have detected advanced cupping as a concavity in the posterior pole anterior to acoustically empty optic nerve area.10The normal eye emitted a continuous echo from the posterior pole which conformed to its mild degree of concavity whereas a discontinuity in the echo from vitreoretinal interface corresponding to the area of optic cup gave further evidence of pathologic optic nerve cupping.10,11
Few studies have shown strong correlation between optical and ultrasonic cup diameters12,13,14,22 and have suggested it to be a useful modality in opaque media.14,22 However, there still remains many lacunae in our existing knowledge. The use of ultrasound as a reliable method to assess optic disc cupping is still debatable and its use in the diagnosis and follow up of glaucomatous patients is not clear.Also, currently we don’t have any guiding clue while assessing optic nerve head status in opaque media.
In this study we aim to study sonographic measurement of optic cup size (SVCD) in glaucoma and normal patients, and compare it with optical parameters and visual fields to assess its reliability in the diagnosis of glaucomatous patients and to find a cut off value forsuspicious glaucomatous cup.
METHODS
It was a Hospital based Observational Study from November 2009 to February 2011.The study protocol received institutional review board approval and followed the tenets of the Declaration of Helsinki. It also received institutional ethical committee approval. We included all patients of primaryopen angle glaucoma (POAG) (on gonioscopy) with adequately clear ocular media. Exclusion criteria were patients with corneal curvature abnormality, recent intraocular surgery and any anterior segment pathology.
50 POAG and 45 Control patients meeting the inclusion criteria were subjected to complete ophthalmic examination including A scan biometry (for axial length), Goldmann applanation tonometry, fundus photography, 30-2 SITA Humphrey visual fields (HVF) and B scan USG. All eyes were subjected to Echorule A-scan ultrasound machine (Biomedix) and axial lengths of the eyes were measured using 10MHzcontact probe. Photographs of the optic disc were taken using using VISUCAM LITE (Carl Zeiss,United States)fundus cameraafter pharmacological pupil dilatation. Optic discs were photographed by an experienced technician and examined by a masked glaucomatologist.The accuracy with which the vertical CDR is measured greatly depends on the certainty with which the position of the edge of the cup was defined. The cup was defined on the basis of vessels’ deflection at the edge and the blurring of the floor of the cup, and not by pallor. Vessels were considered to be part of the cup if there was no underlying rim tissue. Change in direction of vessels in the optic disc was used as a guide to the Neuroretinal rim edge.
Photographic vertical cup diameter (PVCD) of cases and controls were measured using image editing software; Adobe photo shop (Adobe, San Jose, CA) by the same trained observer. Vertical and horizontal CDR were measured. Magnification correction was done using Bengtsson formula.
{magnification=1.336 k/(l-0.0016) where k’ is the camera constant and ‘l’ is the axial length in metres}.15
Using magnification correction, actual values of vertical and horizontal disc and cup diameters were calculated and then cup area, disc area,NRR area and cup area/disc area and NRR area/disc area were calculated.NRR area was calculated using ”disc area – cup area”.Disc or cup area was calculated using formula for ellipse:
horizontal disc or cup diameter x vertical disc or cup diameter x pi/4.16
Sonographic measurements of diameters of optic cup were taken using B-ScanUltrasonography(OTI 2000, Canada).It includes a focused B-Scan probe operating at 10 MHz. The diameters of optic cup were measured. Linear probe was used which was oriented in the vertical transverse plane until the desired view of the optic cup was obtained. The operator was not aware of the fundus photographic findings while measuring optic cup with B-mode sonography.
The probe was applied over the eye with lids closed as we used a long probe which had a normal scan depth of 27mm from the face of the probe (focal length 23mm). The vertical transverse scan was used in which sound beam bypassed the lens providing a cross section of the optic nerve anteriorly, near the globe. The scan was performed with the patient fixating in primary gaze with the probe placed temporally (marker directed superiorly). This results in the display of a circular echolucent defect just behind the globe.
The ultrasound was recorded for each of the eye of patient. Brightness and contrast of the image was set to acquire the best recording.A medium gain setting (60-70dB) was used to optimize resolution of the optic nerve head. Specific section of recording was selected and saved. Particular image in which optic nerve head was best displayed in the centre of the echogram were frozen and was used to measure vertical cup diameter. Maximum vertical cup diameter was defined as the greatest distance between the superior and inferior rim of the anterior concavity of the optic nerve head. Five readings were taken and the mean was calculated. Particular selected image was zoomed and measurement was made by clicking on each end of cursor and dragging it to the required point.All visual field testing was performed using Automated Humphrey field analyser(HFAII-i, Carl Zeiss, United States) using 30-2 threshold programme (SITA standard) and were assessed by a separate glaucomologist without access to clinical information.A glaucomatous visual field was taken to be one in which a defect and other parameters were reproduced on three successive occasions at the same location.Fields were graded as per Hoddap –Parrish –Anderson criteria17
Stats analysis:
Stata 11.2 software was used for statistical analysis and data was presented in frequency(%) and mean (SD). Age in glaucoma and controls were compared using unpaired t- test. And sex in two groups was compared using chi-square test. Continuous variables following nomal distribution were compared in groups using independent t-test (in two group)/one way Anova(more then two groups). Skewed continuous variables were compared by Wilcoxon ranksum. SVCDin the glaucoma and control groups were compared using unpaired t –test. Correlation between photographic vertical cup diameter (PVCD) and SVCD was done using intra-class correlation coefficient and Bland Altman plot was constructed. Correlation of SVCD with various other parameters was done using Karl Pearsons correlation.Various photographic parameters between the two groups were compared using unpaired t-test. Association of visual field grade with SVCD was done using one way ANOVA post hoc test with bonferroni correction. Receiving operative curve (ROC) analysis was carried out to find cut off value for SVCD value.
OBSERVATIONS AND RESULTS
The study consisted of a total of 95 patients (181 eyes). Of them, 50 patients (95 eyes) were POAG (Group 1) and 45 patients (89 eyes) of similar age group were controls (Group 0). The mean age of subjects in glaucoma and controls was 55±12.12 and 50.8±10.97 years respectively (p=0.082). In glaucoma group, there were 22/50 females (49%) and 23/50 males (51%) whereas in controls, there were 28/45 female (56%) and 22/45 male (44%). There was no statistical difference between two groups (p value=0.400).
Value of sonographic vertical cup diameter (SVCD)(Table 1)
The mean ultrasound value of optic cup was 1.06 ± 0.298 mm in glaucoma and 0.798 ± 0.35 mm in control. A statistically significant difference in SVCD in the glaucoma and control groups were noted (p value=0.001).
Correlation between SVCD and PVCD(Figure1)
The mean PVCD is 0.965 ±0.248 mm in glaucoma and 0.650 ± 0.229 mm in controls (Table3). Strong intra-class correlation (ICC)between PVCD and SVCD value has been found; r=0.85(p=0.001) in glaucoma & r=0.82 (p=0.001) in control. Altman plot is also depicting that the two methods are agreeing with each other.
Comparison of ultrasound values with other photographic parameters (Table 2)
SVCD had a strong positive correlation with vertical cup disc ratio (VCDR), cup area, cup area/disc area; strong negative correlation with vertical neural retinal rim width (VNRR), NRR area/disc area and weak negative correlation with NRR area. The findings confirmed the presence of glaucomatous optic neuropathy with increasing SVCD.
Study of various photographic parametersand their correlation (Table 3)
Different variables of disc photographs and biometry were studied in the two groups (Table3). There was no statistical significant difference between glaucoma and control as far as vertical disc diameter (VDD)(p=0.466), disc area and axial length are concerned. All other parameters viz. PVCD,VCDR, VNRR, NRR area, cup area, NRR area, cup area/disc area showed a significant difference in the two groups (p-value0.0001).
There was moderate positive correlation between NRR area &disc area (r=0.5841, p=0.0001 in glaucoma & r=0.637; p=0.0001 in control) and between cup area &disc area (r=0.612.p=0.0001 in glaucoma & r=0.687; p=0.0001 in control).
Correlation between VCDR and NRR area was moderately negative in glaucoma (r= – 0.6138,p=0.0001) and weakly negative in control ( r=- 0.2182;p=0.0435).
Also there was statistically no difference in VDD value between the two eyes of the patients (p>0.05).
Comparison of field changes with sonographicVCD(Table 4)
Severe field grade changes showed positive correlation with SVCD indicating that sonographic cup evaluation is a very good tool in detecting patients with advanced field changes and not very reliable when field changes are mild or moderate.
Evaluation of cut off value of SVCD in glaucoma
For evaluation of cut off value of SVCD in glaucoma, we considered the fact that measurements of neuroretinal rim area remains the same in all normal individuals as it reflects the number of nerve fibres in an eye.18-20 NRR area of control were taken as reference and analysed to determine the lower limit of 95% confidence interval of its mean and standard deviation (Figure2, Table5). Patients below this lower limit minus 2 SD were taken as having abnormal NRR area and above this normal. The values of SVCD and PVCD lying in that interval in all subjects (glaucoma & control) were analysed. ROC curve analysis was done with sensitivity and specificity to derive the cut off limit of PVCD and SVCD. ROC (Receiver operating characteristics)curve analysis or area under ROC curve was used to determine the cut off values for SVCD (Figure 3A) and PVCD (Figure 3B) sensitivity & specificity (Table 6). So 62/86 control eyes had normal NRR area beyond the calculated mean but 26/62 eyes had ultrasonic cup size more than the suggested cut off value and 36/62 eyes had size below cut off value. There were 95 eyes with glaucomatous cup but total 119 eyes from both groups had NRR area value less than the mean critical value. 76/119 eyes had ultrasonic cup size more than cut off value and 43/119 below cut off value. This cut off value came out to be 1.12 and was 87.50 % sensitive and 66.06% specific with 74.51% positive predictive value, 45.57 % negative predictive value and 61.88% diagnostic accuracy
DISCUSSION
In patients with opaque ocular media where fundus cannot be visualised or field cannot be charted and other modalities like HRT, OCT fail to work, evaluation for glaucoma remains a problem. The ability of modern B-scanners to detect optic disc cupping has already been tested by many authors in the past.107-109Cohen et al6 in 1976 made a pilot study to evaluate the usefulness of ultrasound in detecting glaucomatous cupping and he found that advanced degrees of glaucomatous cupping can be detected. LaterFisch and co-workers7 showed that high resolution contact B-scan could accurately categorise cups as small, medium or large. Lately Winder and Atta8in their study evaluated the sensitivity of modern, eye-dedicated B-scanners in detecting optic disc cups andcorrelated the echographic measurements with an optical assessment. They demonstrated their capability of detecting optic disc cups of 0.5 mm or larger. Nadir Ali recently could detect 0.3mm as the smallest cups. Using long probe our study was able to detect cups as small as 0.2mm.
The accuracy of ultrasounds measurements of optic cup has already been established in few studies by comparing the results with those of fundus photography, HRT and OCT. Beatty et al9 found a high degree of correlation between ultrasound and HRT readings for vertical and horizontal cup diameters and to a lesser degree, for optic cup depthwith reliable indices of reproducibility and test–retest variability. Nadir Ali et al10 in their study showed no statistically significant difference between the optic disc cupping measurements using sonography and fundus photography even for small cups.Queiroz et al investigated the correlation between the measures of cup/optic nerve head proportionobtained by examination with a 20-MHz B-mode ocular ultrasound (US) and those of the C/D ratio obtained byfundus biomicroscopy (BIO) and OCT in glaucomatous patients and found strong correlation between them22.
In our study, the mean SVCD in glaucoma patients was 1.06 ± 0.30 mm and 0.798 ± 0.35 mmin controls (p-value=0.001). The SVCD measurement in our study is in coherence with the other studyin the literature.10 The mean (PVCD) was 0.965 ± 0.248mm in group1 and 0.650 ± 0.29mm in group 0. Our study also found a strong positive correlation between SVCD and PVCD in glaucoma as well as control. (p=0.001) (Figure4).
Though studies have authenticated reliability of ultrasound cup measurements but to our best of knowledge there is no study in literature which has attempted to investigate the diagnostic performance of ultrasound in picking up suspicious glaucomatous cups. In our study we attempted giving a cut off value for ultrasonic cups beyond which could raise suspicion of glaucomatous cups. This attempted concept of cut off was based on various studies which reported that measurements of neuroretinal rim area in almost all normal people remain same as it reflects the number of nerve fibres in an eye and is not influenced by the size of the optic disc or by the CDR.18-20 It is a known fact that there is a progressive decrease in neuroretinal rim area in glaucoma. NRR area of normal subjects were analysed to determine the lower limit of 95% confidence interval of each. Mean NRR area in our set of population was Thereafter, the values of SVCD lying in that interval in all subjects were determined. Applying appropriate statistical methods including sensitivity and specificity, we derived at the upper limit value of SVCD as 0.9mm (63.87 % sensitivity and 58.06 % specificity). Similarly, we also calculated upper limit for PVCD which was 0.78mm (59.66% sensitivity and 58.06% specificity). So any value beyond 0.9mm to 1mm could be grossly screened as suspicious for further investigations. This could be most useful in the setting of opaque media when we are clueless regarding optic nerve head status to avoid post operative surprises. Also, comparison with other eye if optically clear will also help in differentiating physiological from pathological cupping
We found that cut off values obtained were not highly reliable (higher sensitivity and specificity).The possible explanation could be that in our study NRR area moderately correlated with disc area in group 0(r=0.6377; p-value 0.001) (Table3) and reason could be that larger discs may have a larger supporting framework or a greater volume of non-neural elements that contribute to the measurement of disc rim area, leading to less effects of glaucomatous optic neuropathy.
Disc diameter is an important parameter to be seen before commenting upon cup diameter.
In our study, we found no statistical difference between the PVCD between the two eyes in both groups. The average difference between right and left vertical disc diameter (VDD) was
-0.011; 95% CI (-0.033,0.011), p- value 0.322 (Table 4). Thus, this implies that it is possible to calculate CDR value in patients whose one eye has opaque ocular media by taking ultrasonographic measurement of optic cup diameter from the same eye and optical disc measurement from fellow eye with clear media. It is a well known fact that when the optic disc is damaged by glaucoma, there is an increase in the optic disc cup and thus a change in the cup disc ratio.21 Therefore in glaucoma patients with a known CDR, follow up and monitoring of glaucoma can be done by ultrasound analysis of optic cup despite development of media haze using disc diameter data from the other eye or previously recorded disc diameter.10
We calculated disc area and cup area and subsequently neuro retinal rim area (NRR area) from photographic method(Table10). The ultrasonic cup values (SVCD) had a strong positive correlation with VCDR, cup area, cup area /disc area; strong negative correlation with VNRR,NRR area/disc area and weak negative correlation with NRR area. This corroborates presence of glaucomatous damage to the NRR with increasing cup size. Sonographic cup evaluation is a very good tool in confirming glaucomatous damage in patients with advanced field changes and not very reliable when field changes are mild or moderate.
Limitations of our study were small sample size and non inclusion of opaque media patients. Also test reliability on two different occasion were not studied. Further studies with large sample size designed specially to study the sensitivity and specificity of the cut off value in picking up glaucomatous cups could be further useful to study diagnostic performance of ultrasound.
Conclusion
To summarise for clear media, there are many modalities of optic disc assessment but in the setting of opaque media the two dimensional measurements of the optic cup measured reliably by ultrasound without the use of an expensive specialized equipmentwill definitely contribute to patient care. Difference in ultrasound cup values greater than two standard deviations between the two eyes can also assist in picking up glaucoma suspects. A substantial increase in the B-scan estimate of optic cup diameter over time can be considered as objective evidence of progression of cupping. Although ultrasound cannot differentiate a pathological cup from physiological one on the basis of size alone, a small cup is less likely to be pathological. Based on strong correlation between photographic cup, sonographic cup and cut off value of SVCD calculated in our study, we suggest ultrasound as a useful screening modality for glaucoma, though it cannot substitute clinical fundus evaluation. Although our study was done on patients with clear media but certainly results of our study can be extrapolated in eyes with hazy media where fundus cannot be visualised. A cut off value for ultrasonic cups was found which could raise suspicion in the diagnosis though we do not say this cut off value should be used as an absolute value in clinical settings but it will certainly add to our advantage when we are clueless while screening the patients of opaque media. More number of studies need to be done in suspected cups to validate the same. In our country, the cataract patients awaiting surgery would benefit from such ultrasonic optic cup measurements, especially in those with previously undiagnosed glaucoma where extensive glaucomatous damage may be present. This will reduce post –operative surprises after cataract surgery.
The results of this study will make it an effective tool in opaque ocular media when other modalities may not be applicable.
Acknowledgement
Mr Ashish Dutt Upadhaya for all his statistcal work
References
1.Resnikoff S, Pascolini D, Etya’ale D, Kocur I, Pararajasegaram R, Pokharel GP, Mariotti SP: Global data on visual impairment in the year 2002 Community Eye Health J. 2004;17(52).
2.Jonas JB, Fernandez MC, StrurmerJ. Pattern of glaucomatous neural retinal rim loss. Ophthalmology.1993;100:63-68.
3.Weisman RL, Asseff CF, Phelps CD,et al. Vertical elongation of the optic cup in glaucoma. Trans Am AcadOphthalmolOtolaryngo. 1973;77:OP157-OP161.
4.Kirsch RE, Anderson DR. Clinical recognition of glaucomatous cupping. Am J Ophthalmol.1985:99:1-4.
5.Burgansky ZE, et al: Detecting glaucoma with Heidelberg retina tomograph 3 (HRT 3). Invest Ophthalmol Vis Sci. 47, 2006. E-abstract 3630.
6.Wollstein G, et al: Comparison of three optical coherence tomography scanning areas for detection of glaucomatous damage. Am J Ophthalmol. 139:39, 2005.
7.Schuman JS, et al: Reproducibility of nerve fiber layer thickness measurements using optical coherence tomography. Ophthalmology. 115: 949–956, 2008.
8.Wollstein G, Garway-Heath DF, Hitchings RA: Identification of early glaucoma cases with the scanning laser ophthalmoscope. Ophthalmology 105:1557, 1998.
9.Byrne SF, Green RL. Ultrasound of the eye and orbit. Philadephia. Mosby;202, p209.
10.Cohen JS, Stone RD, Hetherington J Jr, et al. Glaucomatous cupping of the optic disk by ultrasonography. Am J Ophthalmol. 1976;82:24.
11.Darnley-Fisch, Byrne DA, Hughes JR, et al. Contact B-scan echography in the assessment of optic nerve cupping. Am J Ophthalmol. 1990:109:55.
12.Winder Atta HR. Ultrasonography of the optic disc cup in discs of various sizes. Eye. 1996; 10:732.
13.Beatty, PA. GOOD, J. McLaughlin et al Evaluation of optic disc cupping using high-resolution ocular ultrasound. Eye. 1998; 12:54.
14.Nadir Ali Mohamed et al, Malaysia. Comparison of B-scan sonographic measurements of optic cup with fundus photographic measurements. Journal of clinical ultrasound. 2009.vol 37(5); 285-289.
15.Bengtsson B, Krakau CET. Correction of optic disc measurements on fundus photographs. Graefes Arch ClinExpOphthalmol. 1992; 230:24–8.
16.Jonas JB, Papastathopoulos K: Ophthalmoscopic measurement of the optic disc,Ophthalmology. 102:1102, 1995.
17) Remo Susanna Jr.and Roberto M Vessani. Staging Glaucoma Patient: Why and How? Open Ophthalmol J. 2009; 3: 59–64.
18) Bengtsson B:The variance and co-variance of cup and disc diameters. Acta Ophthalmol. 1976; 54:804-818.
19) Airaksinen PJ,Drance SM,Schulzer M:Neuroretinal rim area in early glaucoma. Am J Ophthalmol. 1985; 99:1-4.
20) Radius RL,Pederson JE:Laser-induced primate glaucoma:II.Histopathology. Arch Ophthalmol. 1984; 102:1693-1698.
21) TuuonenA, Airaksinen PJ. Initial glaucomatous optic disc and retinal nerve fibre layer abnormalities and their progression. AM J Ophthalmol 1991; 111:485-90.
22) Queiroz, Wilian Silva, Lucena, Daniel da Rocha, Ferreira, Juliana de Lucena Martins, Rodrigues, Maria de Lourdes Veronese, & Paula, Jayter Silva. Correlation between cup-to-disc ratio and cup/retrobulbar optic nerve diameter proportion assessed by high-resolution ultrasound in glaucomatous eyes.ArquivosBrasileiros de Oftalmologia 2013; 76(5): 274-277
Table 1. Mean SVCD of group 1 and group 0
| GROUP | NO. OF EYES | MEAN
SVCD(mm) |
MEDIAN
(mm) |
P VALUE |
| 1 | 95 | 1.06±0.298 | 1.12 | 0.001
|
| 0 | 89 | 0.798±0.35
|
0.75
|
Table 2 .Correlation of SVCD with various parameters
| parametres | Correlation coefficient
(p value) |
|
| Control (0) | Glaucoma(1) | |
| VCDR | 0.7568
(0.0001) |
0.6910
(0.0001) |
| VNRR | -0.7072
(0.0001) |
-0.5187
(0.0001) |
| Disc area | 0.3152
(0.003) |
0.3530
(0.0004) |
| NRR area | -0.2717
(0.011) |
-0 .289
(0.005) |
| Cup area | 0.6342
(0.0001) |
.69996
(0.0001) |
| Cup area/disc area | 0.7040
(0.0001) |
0.6505
(0.0001) |
| NRR area/disc area | -0.7040
(0.0001) |
-6.505
(0.0001) |
VCDR-vertical cup disc ratio
VNRR-vertical neuroretinal rim diameter
NRR area-Neuro retinal rim area
Table 3. Study of various photographic and biometric parameters
| variables | group | No of obs | Mean
|
SD
|
P value |
| Axial length | 1
0 |
95
89 |
23.048
22.813 |
1.313
0.859 |
0.1520 |
| VDD | 1
0 |
95
89 |
1.49
1.47 |
0.171
0.139 |
0.466 |
| PVCD | 1
0 |
95
89 |
0.965
0.650 |
0.248
0.229 |
0.0001 |
| VCDR | 1
0 |
95
89 |
0.648
0.433 |
0.146
0.134 |
0.0001 |
| VNRR | 1
0 |
95
89 |
0.521
0.819 |
0.214
0.169 |
0.0001 |
| NRR area | 1
0 |
95
89 |
0.999
1.246 |
0.319
0.1828 |
0.0001 |
| Cup area
|
1
0 |
95
89 |
0.651
0.323 |
0.324
0.221 |
0.0001 |
| Disc area
|
1
0
|
95
89 |
1.650
1.569
|
0.381
0.2866 |
0.1100 |
| Cup area/disc area | 1
0 |
95
89 |
0.388
0.195 |
0.162
o.105 |
0.0001 |
VDD-Vertical disc diamete
Table 4.
| variable | Mean ± SD | P value | |||
| Grade0=10 | Grade 1=23 | Grade 2=22 | Grade 3=24 | ||
| SVCD | 0.964 ±0.27 | 0.971 ±0.33 | 0.981 ± 0.296 | 1.204 ± 0.298 | 0.029
(0 VS 3)=0.001 |
Grades of field (Hoddap –Parrish –Anderson criteria114)
Grade 0-normal.
Grade 1-mild visual field defect,
Grade 2- moderate visual field defect
Grade 3-severe visual field defect
Table 5.Mean NRR area
| Group | MEAN ± SD | 95%CONFIDENCE INTERVAL |
| 1 | 0.9992 ± .0327 | 0.934-1.0641 |
| 0 | 1.246 ± .0197 | 1.207-1.285 |
Table 6. cut off value for PVCD and SVCD
| Cut off of PVCD | Sensitivity | specificity |
| >=0.7814 | 59.66% | 58.06% |
| >=0.7844 | 58.82% | 58.06% |
| Cut off for SVCD | ||
| >=0.9 | 63.87% | 58.06% |
| >=0.93 | 58.06% | 58.06% |
Figures
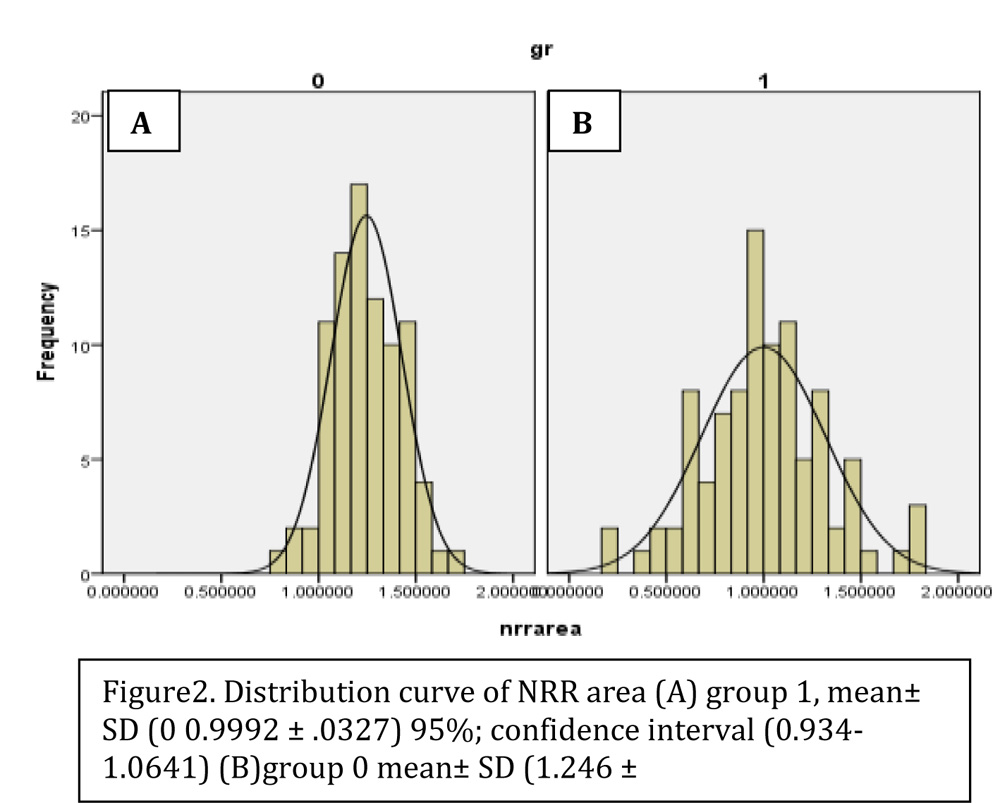
Figure2. Distribution curve of NRR area (A) group 1, mean± SD (0 0.9992 ± .0327) 95%; confidence interval (0.934-1.0641) (B)group 0 mean± SD (1.246 ± .0197)95%confidence interval1.207-1.285 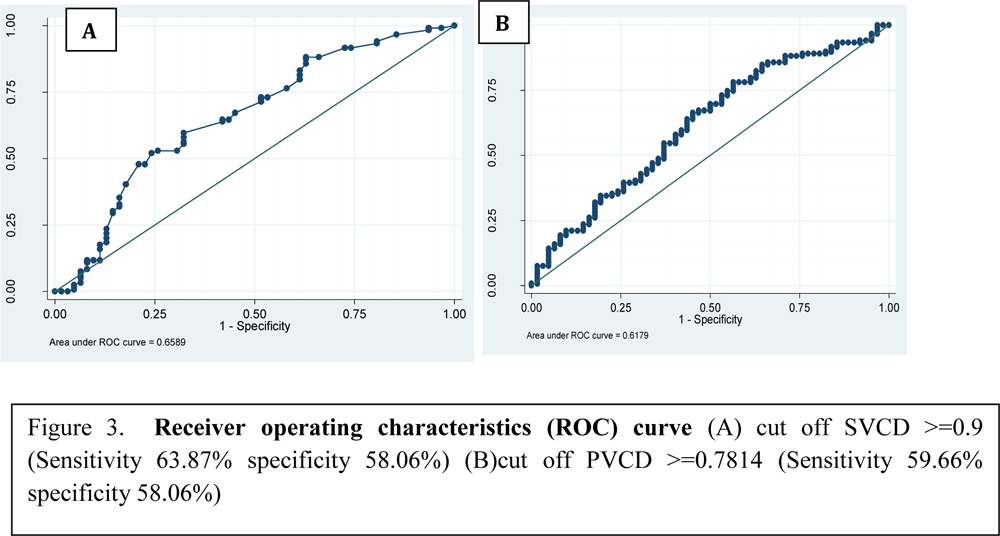

Figure 4. (A) B-Scan USG of right eye of patient no 34; SVCD=1.17mm. (B) Fundus photograph of right eye of patient no 34;VCDR=0.92:1, PVCD=1.19mm. (C) B-Scan USG of left eye of patient no12SVCD=1.13mm. (D)fundus photograph of left eye of patient no 12 VCDR=0.88:1,PVCD=1.11mm