Dr. SheetalHegde, H11738, Dr. Jyoti S Shetty
Pituitary adenoma is a benign and the most common tumour of the pituitary gland. It is also the most common parachiasmal tumor and accounts for approximately 10- 15% of primary intracranial neoplasms1, 2. It has an annual incidence rate of 0.8 – 8 per 1,00,000 population3. Pituitary adenomas are classified as functional and non-functional based on their hormonal activity. Most non-functional adenomas may go unrecognized in early stages. Pressure effects of the enlarging tumor on the visual pathways cause ocular manifestations.
The tumor size is accurately obtained using MRI. Based on size of the tumor, the adenomas are classified either as micro-adenomas (less than 1cm) or macro adenoma (more than 1cm). Macroadenomas usually manifest clinically due to their compressive effect on adjacent structures, most importantly the optic chiasm.
Standard automated perimetry helps in analyzing the visual field defects. Bitemporal field defect is the most common visual abnormality seen in pituitary adenoma. The size and relation of the tumor to the visual pathway affects the changes seen in the visual field
Various studies have suggested that retinal thinning, mainly that of Retinal Nerve Fibre layer (RNFL), Ganglion Cell layer (GCL) and Inner Plexiform Layer (IPL) is significantly associated with chiasmal compression. In pituitary adenoma, the RNFL thinning is more pronounced in the temporal and nasal disk sectors, whereas GC-IPL (together known as ganglion cell inner Plexiform layer) thinning mainly is noted in the nasal sectors of macula. SD optical coherence tomography (OCT) is used to analyze the thickness of the RNFL at the disc and GC-IPL thickness at the macula.
The visual field changes and thinning of retinal layers are related to the size of the tumor. This study intends to find if any significant correlation exists between the parameters mainly visual acuity, tumor volume, visual fields and OCT. This study also aims at exploring if any prognostic significance can be assigned to these tests, either individually or in relation to each other.
METHODS
48 patients diagnosed with pituitary adenoma on MRI were prospectively studied from the outpatient department in our institution between June 2014 to June 2016. Inclusion criteria was all cases diagnosed (and confirmed on MRI) as pituitary adenoma by a neurologist and referred to our hospital for further evaluation. Patients with other cranial tumours; co-existing glaucoma/cataract; coexisting retinopathies and macular disorders; recurrence of tumor after previous surgery and patients too ill to allow visual field examination were excluded from the study.
In the preoperative assessment all patients underwent a complete ophthalmic examination including best corrected Snellen distant and near visual acuity; test for pupillary reaction to light, extraocular movements; anterior segment examination on slit lamp; intraocular pressure with Perkin’s tonometer, fundus examination by direct and indirect ophthalmoscopy; visual field testing by Humphrey Field Analyzer ( 30-2 SITA fast) and Optical Coherence Tomography (Spectral Domain OCT) for RNFL thickness and macular thickness (GCIPL)
Control group patients were identified from general OPD based on age. After slit lamp bio-microscopy those who were ruled out to have any ocular and systemic pathologies were subjected to visual fields test and OCT imaging.
AUTOMATED PERIMETRY
All patients and controls underwent visual field examination using standard automated perimetry with 30-2 SITA FAST strategy, (Humphrey Field Analyzer; Carl-Zeiss Meditec, Dublin, CA), with Goldmann size III target. Near refractive correction was used, calculated according to the subjects’ age by the perimeter software. Reliability criteria were false positives, false negatives, or fixation losses less than 33%.
OCT
Patients and controls underwent ocular imaging with dilated pupils using Spectral Domain OCT scanner (Cirrus; Carl Zeiss Meditec, Dublin, CA). Good-quality scans had to have focused images and signal strength equal to or higher than 7 and a ring centered around the optic disk in the case of the RNFL scans. For macula scans, the radial scans had to be centered on the fovea. Peripapillary RNFL thickness parameters including average thickness (360°); temporal, superior, nasal, and inferior quadrant were obtained. Macular thickness parameters were divided in to 6 sectors I to VI clockwise in right eye and anti-clockwise in left eye. Average thickness of GCIPL along with individual thickness of each sector was obtained.
The vision (BCVA) and MRI tumour volume was correlated with each other and also with other parameters like MD, PSD in visual fields and RNFL and GCIPL in OCT. Controls and patients were compared in terms of MD, PSD, RNFL and GCIPL and results were analysed.
STATISTICAL ANALYSIS
The Pearson correlation coefficient, was used to evaluate any correlation between two continuous variables. Spearman coefficient of correlation was used to correlate two non parametric variables. Also, Mann-Whitney U test and a two tailed chi-square test was used to find the significance of study parameters on categorical scale between two or more groups and a p value of <0.05 was considered as significant for measured variables. The statistical software namely SAS 9.2, SPSS 15.0, Stata 10.1, Med Calc 9.0.1 ,Systat 12.0 and R environment ver.2.11.1 were used for the analysis.
RESULTS
AGE– Most of the patients were in age group 30 to 50 years. Mean age in the study group was 40.19 ± 10.59 years. Most of the controls were in age group 20-40 yrs. Mean age in control group was 35.93 ± 11.07 years.
GENDER– Equal gender distribution was present in both study and control group i.e., 50% male and 50% female.
MRI– Most of the patients (85.4%) had a tumor volume of <25 cubic cm.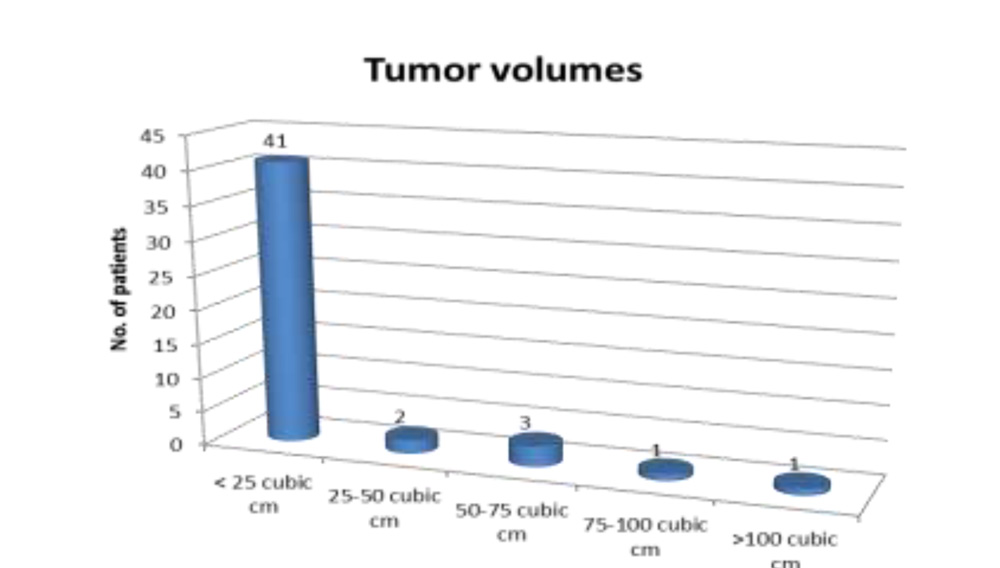
VISUAL FIELD DEFECTS
Unilateral visual field examination of the worse eye was evaluated in 42 patients. 22(52.8%) patients had no field defect. 6(14.2%) patients had supero- temporal quadrantanopia, 8(19.2%) had temporal hemianopia . Arcuate defect was seen in 1(2.4%), tubular fields in 3(7.2%) and generalised depression in 2(4.8%) of the patients
COMPARISON OF MD AND PSD VALUES
Most of the patients had a mean deviation value below -10dB i.e., 28(67.2%). Mean visual field MD value was -8.18 ± 8.65 dB.
26(62%) of patients had a PSD value below 5dB. Mean visual field PSD value was 5.26 ± 4.87 dB.
The MD value was grossly lower in patients with pituitary adenoma (mean ± sd =-12.16 ± 21.73dB) than in the control group (mean ± sd = -2.0±1.8dB). Also compared to PSD values in controls (mean ± sd =1.9 ± 1.0dB), we found that PSD of patients (mean ± sd = 5.76 ± 49dB) was more . P value was significant at <0.05 for both MD and PSD using Mann-Whitney U test
OCT PARAMETERS
In patients with pituitary adenoma, the RNFL thickness of nasal (64.36 ± 14.3µm) and temporal (57.04±13.0 µm) sectors were thinner when compared to superior (106.84 ±2 7.1 µm) and inferior (117.7 ± 25.1 µm) sectors, with temporal being thinner than nasal sector.
Sectors of GCIPL measured at macula in our study showed that infero-nasal and inferior sectors were thinner in comparison to rest of the sectors.
Mean RNFL thickness in patients was 85.9 ± 14.5µm which was lower than when compared to controls (mean ± sd = 92.4 ± 7.6µm) Mean GCIPL thickness in patients was 71.6 ± 17.2µm which was also less when compared to controls (mean ± sd = 80.4 ± 4.0µm). Hence both RNFL and GCIPL thickness at disc and macula respectively was reduced in patients with pituitary adenoma compared to normal population. (P value was significant at <0.05 using Mann-Whitney U test.)
CORRELATION BETWEEN DIFFERENT PARAMETERS
1) MRI tumor volume with BCVA– Most of the patients with tumor volume less than 25cm3 had BCVA better than 6/18, however there was no significant relation between BCVA and tumor volume at p>0.05 (chi-square value r = 4, p value 0.163)
2) MRI tumor volume with visual field analysis– Using chi square value of 43.31(p<0.01) it was observed that the total and pattern deviation plot interpretation of visual field is significantly dependent on the MRI based tumor volume.
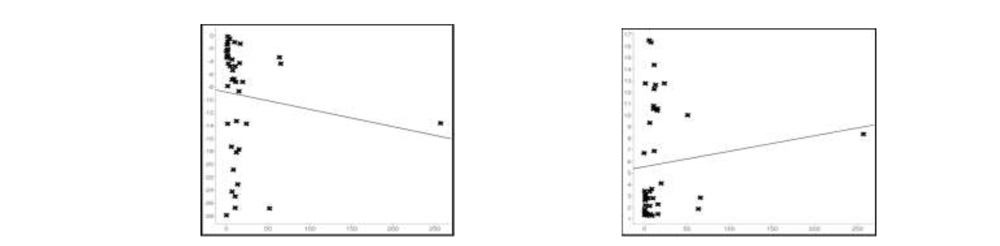
A) MD Tumor volume with MD B) Tumor volume with PSD
Tumor volume and MD of visual fields correlated negatively, while tumor volume and PSD correlated positively. However the p values in both (0.422 and 0.47 respectively) indicated that the correlation was statistically insignificant
3) OCT parameters with MD and PSD of Fields.
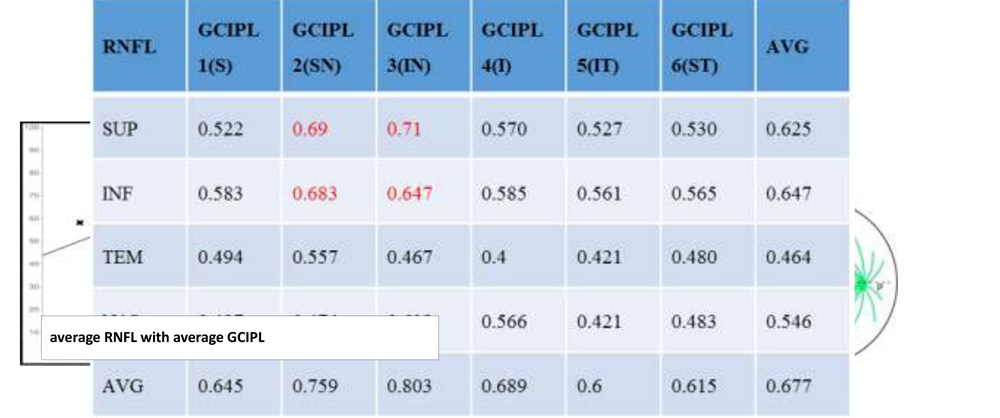
Spearman Correlation was used to compare the RNFL and GCIPL sectors with respect to MD and PSD. All RNFL and GCIPL sectors correlated strongly with MD and PSD with a p value <0.01 in all. Nasal sectors of GCIPL (2,3) showed a very strong correlation to both MD and PSD. A positive correlation was seen on correlating MD with RNFL and GCIPL. Hence we can expect more thinning in lower values of MD. PSD values are negatively correlated to RNFL and GCIPL indicating a rise in PSD values would show thinner retinal layers. Average RNFL correlates well with both MD and PSD
4) Tumor volume in relation to RNFL AND GCIPL (OCT based colour coding)
With chi square value of 41.1 AND 43.54, and p value <0.01, a significant relationship existed between tumour volumes and average thickness of RNFL. and GCIPL respectively.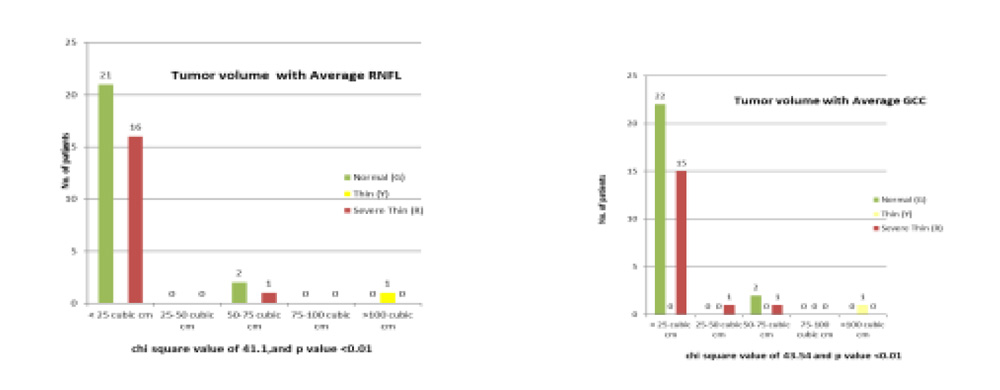
- Correlation of fields and OCT parameters
Most of the patients who had MD value less than -10 dB had normal thickness of GCIPL i.e., green. Patients with more than -10 dB value of MD show thinner GCIPL (red). Chi square test values of 14.46 and p value 0.02(<0.05) was significant.
Most of the patients with a PSD values below 10 dB had thicker RNFL (Age-matched statistical analysis: Green) than those above 10 dB. Chi square value of 24.7 and p <0.01 made the relation statistically significant.
GCIPL seemed to be normal (age-matched statistical analysis: green) up to a PSD value below 5dB in most of the patients and thinner (red) GCIPL was seen in patients with higher PSD values. Chi square values of 24.6 and p value <0.01 made the relation significant. However, GCIPL thinning could be appreciably noticed even in PSD value below 5dB indicating early changes in GCIPL layer in the disease. This also implied a better and early detection of neuro-ophthalmic disorder by GCIPL (p value 0.002) when compared to RNFL (p value 0.007). Also, PSD values showed a more significant (p<0.01) relation than MD (p<0.05) with both average RNFL and average GCIPL indicating PSD as a more sensitive tool of investigation in this disease. 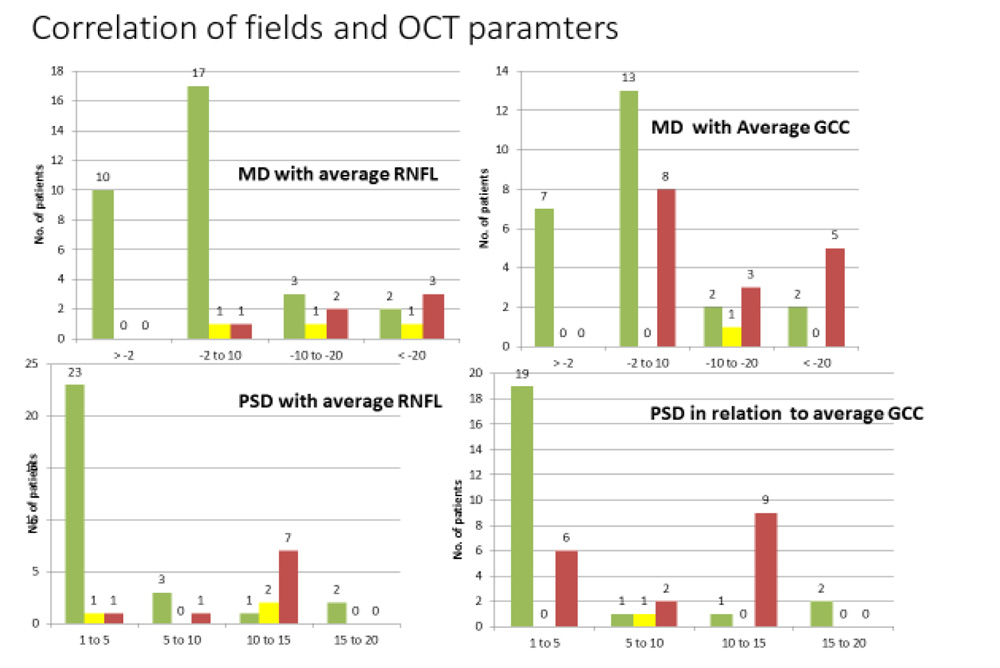
It was observed that all the RNFL and GCIPL sectors highly correlated with each other with p value <0.05. Overall the nasal sectors of GCIPL showed more thinning than rest of the sectors when compared to RNFL sectors (esp. sup. and inf.) correlating with the loss of nerve fibre along the papillo-macular bundle arrangement.
DISCUSSION
In the present study, 96 eyes of 48 pituitary adenoma patients (confirmed on MRI scanning) along with age and gender matched controls, underwent complete ophthalmic evaluation, visual field examination and OCT test for evaluation of retinal thickness. BCVA did not significantly correlate with MRI based tumor volume in our study with p value 0.163(>0.05) indicating the importance of tumor height than volume. A probable explanation is based on a study by Kathrin Schmalisch et al4 which states that tumor height is superior for estimating the effect of tumor compression on visual pathways than tumor volume.
Standard automated perimetry with 30-2 SITA fast strategy using a Humphrey Field Analyzer was conducted in all patients and controls. Total and pattern deviation plot readings showed bitemporal hemianopia in 5(12.2%) of 42. Bitemporal superior quadrantanopia, arcuate defects, tubular fields and homonymous hemianopia were the other field defects seen.5
MD and PSD values obtained from the automated perimetry chart showed gross changes when compared to controls. MD value (-8.18 ± 8.65dB) was depressed than control group (-2.0 ± 1.8dB) and PSD value (5.76 ± 4.8dB) were higher than controls (1.9 ± 1.0dB). MD was observed to have a negative correlation with MRI tumor volume using Spearman correlation (r = -1.27, p>0.05). PSD exhibited a positive correlation with tumor volume (r = 0.11, p >0.05). The test was however insignificant due to a high p value >0.05.
Mean RNFL and Mean GCIPL values on OCT showed global thinning in both RNFL and GCIPL layers in patients when compared with controls. On correlation of visual fields and OCT parameters using Spearman’s correlation, it was observed that MD and PSD correlated with all the sectors of RNFL and GCIPL significantly (p<0.01). MD showed a positive correlation with RNFL and GCIPL implying more thinning in lower values of MD. PSD values are negatively correlated to RNFL and GCIPL indicating, a rise in PSD values would show thinner retinal layers. Average RNFL correlates well with both MD and PSD. Nasal sectors of GCIPL (2,3) show a very strong correlation to both MD and PSD. In our study we also correlated all RNFL sectors with all GCIPL sectors using Spearman’s correlation coefficient. All the sectors correlated very well with each other (p<0.05). It is observed that correlation between average RNFL and average GCIPL was very high (r = 0.677).
Significant relationship (p<0.01) using chi-square test was found between tumor volumes and average RNFL (r=41.1) and average GCIPL (r=43.5) thickness based on color coding by OCT machine. There was no significant relation found between vision (BCVA) and average RNFL or GCIPL thickness based on color coding by OCT machine with p value >0.05.
On comparing color coding thickness of OCT parameters (average RNFL and average GCIPL) with MD and PSD we found a correlation existing between these parameters. More thinning is seen at lower values of MD and higher values of PSD. With stronger correlation of PSD (p <0.01) values than MD (p<0.05) with OCT parameters, PSD is considered a more sensitive tool of investigation in this disease. Even with MD values less than -2 dB and PSD values below 5dB, severe thinning of GCIPL layer could be diagnosed, implying GCIPL to be better than RNFL in OCT parameters.
In our study, macular measurements correlated significantly better with visual field sensitivity than with RNFL thickness measurement. This could be explained by the fact that only the nasal segment of optic disc receives fibres exclusively from nasal hemiretina, all the other areas receive fibres from nasal and temporal hemiretina. This explains the lowered specificity of RNFL values compared to macular segments.
CONCLUSION
To conclude, our results indicate that visual parameters, tumor volume, visual fields and OCT were all found to be valuable investigations individually and in correlation to each other for diagnosis of pituitary adenoma. The disease causes a decrease in the mean parameters of perimetry like MD and PSD and mean parameters of OCT like RNFL and GCIPL, when compared to healthy controls. Tumor volume correlated well with visual fields and average RNFL and GCIPL. PSD was concluded to be a more sensitive parameter than MD. GCIPL showed good prognostic significance when compared to RNFL in the disease process by getting involved early in the disease and also showing maximum correlation to fields (MD or PSD) and RNFL sectors. In case of unreliable fields report or reports not corresponding to disease progress an ophthalmologist should consider retinal thickness parameters especially GCIPL thickness at macula for prognosticating the disease.
Our study thus reinforces the effectiveness OCT for prognosticating the neurological disorder like pituitary adenoma and to understand the structural and functional relationship of the disease process
BIBLIOGRAPHY
1) Albert, Daniel M., Joan W.Miller, Dimitri T.Azar. Albert & Jakobiec’s, Principles and Practice of Ophthalmology. 3rd ed. Vol 3. Philadelphia: Saunders Elsevier; 2008.P. 3820-3941.
2) Dhasmana R, Nagpal RC, Sharma R, Bansal KK, Bahadur H. Visual Fields at Presentation and after Trans-sphenoidal Resection of Pituitary Adenomas. Journal of Ophthalmic & Vision Research. 2011; 6 (3):187-191.
3) Wang H, Sun W, Fu Z, Si Z, Zhu Y, Zhai G et al. The Pattern of Visual Impairment in Patients with Pituitary Adenoma. Journal of International Medical Research. 2008; 36 (5):1064-106
4) Kathrin Schmalisch, Monika Milian, Thilo Schimitzek. Predictors for Visual Dysfunction in Nonfunctioning Pituitary Adenomas-Implications for Neurosurgical Management. Clin Endocrinol. 2012; 77(5):728-734.
5) Dhar MY, Pehere NK. Unusual Visual Manifestations of Pituitary Tumours. Kerala Journal of Ophthalmology. 2007:147