Dr. ApoorvGrover, G12464, Dr. Sonal Gupta, Dr. BipulBhushan, Dr. Alok Sen
Authors- Dr Apoorv Grover, Dr Sonal Gupta, Dr Bipul Bhushan, Dr Alok Sen
Introduction-
Diabetic retinopathy is known to be one of the leading causes of blindness among the working age group (1,2). India, over the next two decades, is expected to become one of the major hubs of diabetic population according to the World Health Organisation (2).
Early detection and intervention is known to prevent severe visual loss in patients with diabetic retinopathy (3,4). Microaneuryms seen at the posterior pole on dilated biomicroscopic evaluation are the first sign of diabetic retinopathy (5). Fundus fluorescein angiography, although more sensitive to detect early diabetic retinopathy, is also a time consuming and invasive procedure, and therefore is not indicated as a routine procedure for early evaluation in eyes of diabetic patients (5,6).
Optical coherence tomography angiography (OCTA) is a fast, noninvasive imaging technique that uses motion contrast to create OCT angiograms by comparing the decorrelation signal among sequential OCT B-scans (7,8). The AngioVue system (Avanti OCT; Optovue, Fremont, CA) divides the retina– choroid layer into four layers that include the superficial capillary plexus, deep capillary plexus, outer retina, and the choroidal vessels (9). This study attempts to investigate the FAZ in eyes of diabetic patients with no or early retinopathy, and to correlate the changes in FAZ with the clinical staging of diabetic retinopathy and other parameters.
Methods-
This was a prospective study of consecutive diabetic patients (with no or early retinopathy) and controls, who underwent fundus evaluation and subsequent OCTA imaging at the department of Vitreoretina, Sadguru Netra Chikitsalaya, Jankikund, Chitrakoot from 1st February to 15th May 2016. Informed consent was obtained from all patients enrolled for the study.
Patients with proliferative diabetic retinopathy, macular edema, previous laser photocoagulation, refractive error ≥ 6 dioptres, or any other chorioretinal disease (including any vitreretinal interface abnormality) were excluded from the study. Patients with poor quality OCTA images due to hazy media or poor fixation were also excluded. An age matched control group of normal, non diabetic eyes was included in the study for comparison. Age, best corrected visual acuity (BCVA) and duration of diabetes were recorded for all patients. HbA1c levels were noted where available. The above mentioned factors were analysed for correlation with the area of the FAZ in diabetic patients.
Optical coherence tomography angiography images were obtained by using the Avanti RTVue XR with AngioVue (Optovue, Inc) instruments. AngioVue uses the split-spectrum amplitude-decorrelation angiography algorithm to detect erythrocyte movement, thereby enabling non invasive visualisation of retinal and choroidal vasculature via motion contrast. AngioVue system automatically divides the retina-choroid into four layers- the superficial capillary plexus layer (SL), deep capillary plexus layer
(DL), outer retina layer, and the choriocapillaris. The SL images show the vasculature from the inner limited membrane to 15 mm under the inner plexiform layer, which comprises the vasculature in the
retinal nerve fiber layer and ganglion cell layer. The DL images show the vasculature from 15 mm under the inner plexiform layer to 70 mm under the inner plexiform layer, including the vasculature from either side of the inner nuclear layer.
In this study, the SL and DL were evaluated on the 3×3 mm OCT Angiogram image of the macula in each eye of the patients enrolled. Eyes where OCTA images were deemed to be poor due to motion artefacts were excluded from the final analysis.
FAZ area was measured using ImageJ software. We have considered the FAZ area of the SL in our calculations, as the exact demarcation of borders in the DL was not always possible due to the shadowing of capillaris from SL. All measurements were performed by a vitreo retina specialist twice in a masked fashion. The acceptable margin of error between the two measurements was 10%. The measurements were averaged to obtain a final value. Foveal avascular zone
remodeling was defined as any of the following changes: capillary nonperfusion adjacent to the FAZ, FAZ asymmetry due to a ragged or punched-out border, or loss of the normal spider web-like architecture of capillaries in the perifoveal area. Each eye was noted for the presence or absence of these changes in SL and DL.
Statistical analysis was performed by the SPSS program for Windows, version 17.0 .Continuous variables are presented as mean ± SD, and categorical variables are presented as absolute numbers and percentage. Data were checked for normality before statistical analysis using Shaipro Wilk test. Normally distributed continuous variables were compared using ANOVA. If the F value was significant and variance was homogeneous, Tukey multiple comparison test was used to assess the differences between the individual groups; otherwise, Tamhane’s T2 test was used. Normally distributed continuous variables were compared using the unpaired t test for two groups. Spearman Correlation was also used among various variables. For all statistical tests, a p value less than 0.05 was taken to indicate a significant difference.
Results-
Patient characteristics-
This study evaluated a total of 140 eyes. There were 55 eyes in the group with mild-moderate non proliferative diabetic retinopathy (NPDR group), 44 eyes in the group with diabetic eyes with no retinopathy (NDR group), and 41 eyes of healthy controls. The three groups exhibited no significant difference in the baseline characteristics, including age, gender and best corrected visual acuity (Table 1 and Table 2)
Table 1
| NPDR Group | NDR Group | Control Group | P Value | |
| Mean ± SD | Mean ± SD | Mean ± SD | ||
| Age | 52.87 ± 7.26 | 54.27 ± 8.07 | 50.46 ± 6.49 | 0.411 |
Table 2
| Sex | Groups | P Value | ||
| NPDR | NDR | Control | ||
| Frequency (%) | Frequency (%) | Frequency (%) | ||
| F | 15 (27.3%) | 10 (22.7%) | 13 (31.7%) | 0.648 |
| M | 40 (72.7%) | 34 (77.3%) | 28 (68.3%) | |
| Total | 55 (100%) | 44 (100%) | 41 (100%) | |
The mean HbA1c was similar in the NPDR and NDR groups (8.32 ± 0.90 and 8.53 ± 0.98 respectively, p value 0.536). The known duration of diabetes was significantly higher in the NPDR group than in the NDR group (9.71 ± 6.74 and 6.57 ± 4.62 respectively, p value 0.012)
Table 3
| NPDR Group | NDR Group | |||
| Mean ± SD | Range | Mean ± SD | Range | |
| Duration of diabetes (in years) | 9.71 ± 6.74 | 1.00 – 26.00 | 6.57 ± 4.62 | 0.50 – 20.00 |
Foveal Avascular Zone Area
The mean FAZ area was 0.42 ± 0.17 in the NPDR group, 0.37 ± 0.14 in the NDR group and 0.35 ± 0.07 in the control group. The difference in the FAZ area was significant in NPDR group as compared to the control group (p < 0.05). However, we did not find a significant difference in FAZ area between the NPDR and the NDR groups, or the NDR and the control group (Table 4)
Table 4
| NPDR Group | NDR Group | Control Group | P Value | ||||||
| Mean ± SD | Mean ± SD | Mean ± SD | |||||||
| FAZ AREA | 0.42 ± 0.17 | 0.37 ± 0.14 | 0.35 ± 0.07 | 0.047 | |||||
| P Value | NPDR Group V/S NDR Group | NPDR Group V/S Conrtol Group | NDR Group V/S Control Group | ||||||
| 0.047 | 0.280 | 0.029 | 0.910 | ||||||
FAZ Remodeling
Foveal avascular zone remodeling was defined as any of the following changes: capillary nonperfusion adjacent to the FAZ, asymmetry of the FAZ due to a ragged or punched-out border, or loss of the normal spider web-like architecture of capillaries in the perifoveal area. FAZ remodeling was noted in 80% of eyes in NPDR group, 56.8% of eyes in NDR group, and 12.2% of eyes in the control group. This was highly significant (p<0.001) (Table 5) (Figure 1)
Table 5
| FAZ remodelling (+/-) | Groups | P Value | |||||||
| NPDR | NDR | Control | |||||||
| Frequency (%) | Frequency (%) | Frequency (%) | |||||||
| Absent | 11 (20.0%) | 19 (43.2%) | 36 (87.8%) | <0.001 | |||||
| Present | 44 (80.0%) | 25 (56.8%) | 5 (12.2%) | ||||||
| Total | 55 (100%) | 44 (100%) | 41 (100%) | ||||||
| P Value | NPDR Group V/S NDR Group | NPDR Group V/S Conrtol Group | NDR Group V/S Control Group | ||||||
| <0.001 | 0.013 | <0.001 | <0.001 | ||||||
Correlation between the FAZ area & other parameters
This was analysed to determine other factors that might influence the FAZ area in diabetics. While both age and duration of diabetes were found to have a significant correlation with FAZ area in the NPDR group, it was not so in the NDR group (Table 6 & Table 7). When diabetics were analysed together as one group, only the duration of diabetes was found to have a significant correlation with FAZ area (p= 0.003). We had access to the HbA1c value in only a limited number of patients in the study, and it was not found to have a significant correlation with FAZ area.
Table 6- NPDR group- correlating factors with FAZ area
| P value | ||
| AGE | r | .274* |
| p value | 0.043 | |
| DURATION OF DIABETES (in years) | r | .427** |
| p value | 0.001 | |
| HBAIC | r | 0.016 |
| p value | 0.931 |
Table 7- NDR group- correlating factors with FAZ area
| P value | ||
| AGE | r | 0.155 |
| p value | 0.316 | |
| DURATION OF DIABETES (in years) | r | 0.062 |
| p value | 0.688 | |
| HBAIC | r | -0.497 |
| p value | 0.144 |
Discussion
Currently, a dilated biomicroscopic examination of the fundus is the standard screening test for diabetic retinopathy. Optical
coherence tomography angiography provides a quick, noninvasive
technique to image the FAZ and surrounding retinal vasculature in detail without dye injection and may detect early retinal changes that are otherwise undetectable on examination or with photographic telemedicine techniques.
This study evaluated the area and presence of altered characteristics of FAZ (FAZ modulation) detected by OCTA in diabetic eyes with no or early retinopathy. We found a significantly large size of FAZ area in eyes graded as mild-moderate retinopathy as compared to controls. However, there was no significant difference in FAZ area between the NDR and the NPDR group, and the NDR and the control group.
Takase et al (10) and De Carlo et al (11) previously studied the FAZ area in diabetics on OCTA, where they found a statistically significant enlargement in diabetic eyes without retinopathy as compared to control eyes. In our study, although we found a statistically significant difference in the area of FAZ between the diabetic eyes with early (mild-moderate NPDR) retinopathy with the control group, the difference was not significant when diabetic eyes with no DR were compared with the control group. The difference in the finding in our study may be attributable to the interindividual variation in the size of FAZ. Rather than the absolute area of FAZ, we feel that the presence of altered characteristics of FAZ and surrounding microvasculature (defined as FAZ modulation in this study), may be a more important factor to determine early fundus changes in diabetics. In our study, we found that 80% of eyes with early diabetic retinopathy (mild-moderate NPDR) had FAZ modulation, as against 56.8% diabetic eyes with no diabetic retinopathy and 12.2% of control eyes. This was highly statistically significant (p<0.001). This is in accordance with the study by De Carlo et al (11), who noted FAZ remodeling in 22 of 61 diabetic eyes (36%), and three of the 28 control eyes (11%; P = 0.01).
The current major limitations of OCTA as a viable screening tool are the limited field of view, and movement artifacts resulting in image quality degradation (Figure 2). Although image quality was high enough to show fine microvascular changes in most of the 3×3-mm OCT angiograms, we had to exclude a number of eyes due to poor image quality. Also, diabetic patients who do have a good visual acuity may have difficulty fixating, leading to a difficulty in acquiring high quality scans in these patients and a deterioration of image quality. Another limitation of this study is that color fundus photographs were not used as an adjunct to biomicroscopic fundus examination, which can be physician dependent, to determine whether the eyes had DR. Interindividual variations of FAZ size may confound the comparison FAZ area between groups. As observed by Takase et al (10), an OCTA database on the size of the FAZ in “healthy controls” will have to be created to detect the early diabetes–related changes in eyes without diabetic retinopathy. However, repeat OCTA scans on follow up may be helpful in detecting minute changes in macular microvasculature and FAZ area which may otherwise be undetectable on routine clinical evaluation.
To summarise, evaluation of diabetic eyes on OCTA revealed a clinically significant enlargement of FAZ in eyes with early diabetic retinopathy, which was not seen in eyes without retinopathy. This enlargement also correlated with the duration of diabetes in these patients. Most diabetic eyes with retinopathy, and majority of diabetic eyes without retinopathy were seen to exhibit remodeling of FAZ, indicative of early macular micorcirculatory impairment. Further studies to longitudinally follow diabetic patients and to clinically correlate these macular microvascular changes may provide further evidence of the utility of OCTA as a screening tool, and as an adjunct to the current standard imaging techniques.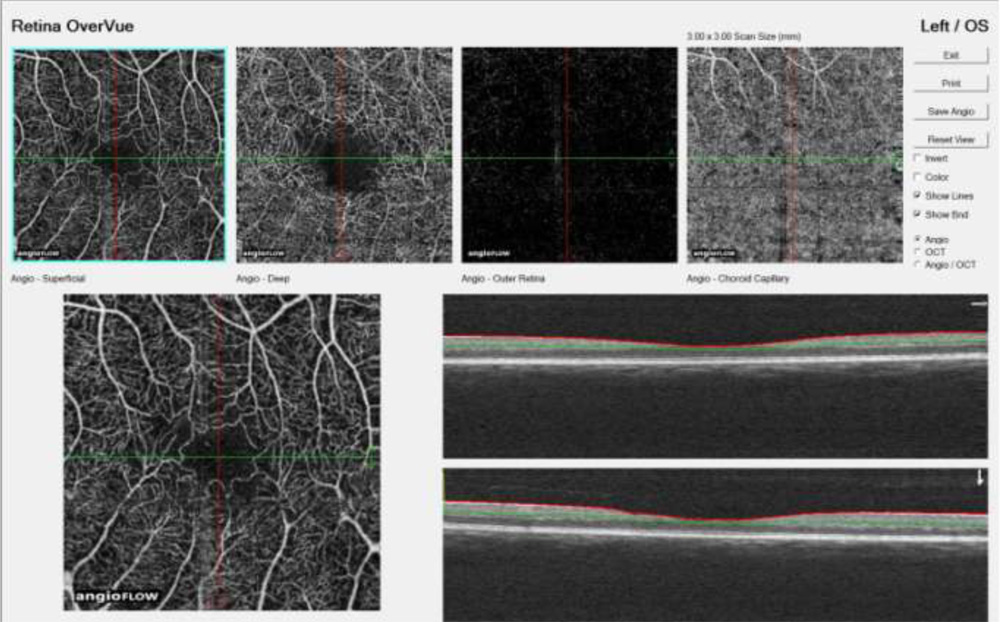
Figure 1– OCTA of left eye of a patient with mild NPDR with BCVA 20/20 demonstrates remodeling of the FAZ, seen as areas of capillary nonperfusion adjacent to the FAZ, and loss of the normal spider web-like architecture of capillaries in the perifoveal area.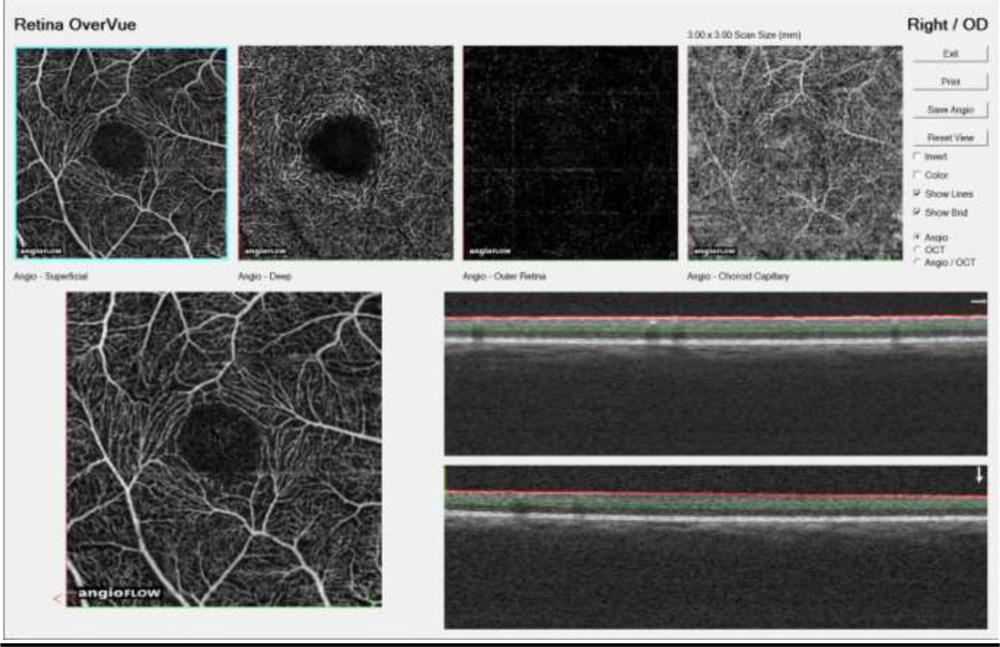
Figure 2– OCTA image of a healthy FAZ of a normal non diabetic eye- reveals a spider web like pattern of perifoveal capillaris. A motion artifact is seen as a line near the inferior border of the FAZ
Bibliography
- Eye Diseases Prevalence Research Group. Causes and prevalence of visual impairment among adults in the United States. Arch Ophthalmol 2004;122:477–85
- Wild S, Roglic G, Green A, et al. Global prevalence of diabetes: estimates for the year 2000 and projections for 2030. Diabetes Care 2004;27:1047–53
- Davis MD, Fisher MR, Gangnon RE, et al. Risk factors for high-risk proliferative diabetic retinopathy and severe visual loss: early Treatment Diabetic Retinopathy Study Report #18. Invest Ophthalmol Vis Sci 1998;39:233–252
- Schoenfeld ER, Greene JM, Wu SY, Leske MC. Patterns of adherence to diabetes vision care guidelines: baseline findings from the Diabetic Retinopathy Awareness Program. Ophthalmology 2001;108:563–571.
- Wiley HE, Ferris FL III. Nonproliferative diabetic retinopathy and diabetic macular edema. In: Ryan SJ, Sadda SR, Hinton DR, eds. Retina. London, United Kingdom: Elsevier Saunders; 2013:940–968
- Kwiterovich KA, Maguire MG, Murphy RP, et al. Frequency of adverse systemic reactions after fluorescein angiography. Ophthalmology 1998;98:1139–1142
- de Carlo TE, Romano A, Waheed NK, et al. A review of optical coherence tomography angiography (OCTA). Int J Retina Vitreous 2015;1:5.
- Matsunaga D, Puliafito CA, Kashani AH. OCT angiography in healthy human subjects. Ophthalmic Surg Lasers Imaging Retina 2014;45:510–515
- Jia Y, Tan O, Tokayer J, et al. Split-spectrum amplitudedecorrelation angiography with optical coherence tomography. Opt Express 2012;20:4710–4725.
- Noriaki Takase, Miho Nozaki, Aki Kato et al. Enlargement Of Foveal Avascular Zone In Diabetic Eyes Evaluated By En Face Optical Coherence Tomography Angiography. Retina 35:2377–2383, 2015.
- De Carlo T, Chin At, Bonini Filho Ma at al. Detection of microvascular changes in eyes of patients with diabetes but not clinical diabetic retinopathy using optical coherence tomograph angiography. Retina 35:2364–2370, 2015