Dr. Ranjini H,
H18626, Dr. Praveen Ramachandra Murthy, Dr.
Gowri Jaydev Murthy, Dr. Vinay R Murthy
ABSTRACT
DESIGN:
Prospective case-control, comparative, interventional study
METHODS:
In each group,55 eyes of 55 patients underwent cataract surgery using either FLACS (laser group) or conventional phacoemulsification (control group). UCVA, BCVA, specular microscopy, pachymetry, mean absolute error(MAE) and anterior chamber depth(ACD) were compared between two groups at 4 weeks postoperatively. Intraoperative effective phaco time was recorded. Circularity, capsular overlap over the edge of the IOL and de-centration of the IOL was measured.
RESULTS:
No significant difference for following parameters: UCVA, pachymetry, MAE, ACD at 4 weeks postoperatively.
Laser group was significantly better for following parameters: BCVA, circularity of capsulorhexis (p=0), circular overlap over the edge of IOL(p=0) and decentration of IOL (p=0.002) at 4 weeks postoperatively. Effective phaco time was significantly lower in laser group for similar grade of cataract. Endothelial cell loss in the laser group was 4.2% more as compared to control group.
INTRODUCTION
Phacoemulsification is the surgical procedure of choice for cataract routinely providing excellent visual and safety outcomes. Nevertheless, it is not a perfect procedure and room for improvement exists1. The femtosecond laser is now commercially available to perform three steps in cataract surgery: Capsulotomy, lens fragmentation and corneal incisions.
There are four platforms available for femtosecond assisted cataract surgery:
Lensx, LensAR, Catalys(Optimedica) and Victus (Technolas)
In this study, an attempt is made to compare the outcomes of femtosecond laser-assisted cataract surgery using LenSx Femtosecond laser to standard 2.2 mm clear corneal phacoemulsification.
AIMS AND OBJECTIVES OF THE STUDY
To compare the outcomes of Femtosecond laser assisted cataract surgery to standard 2.2 mm clear corneal phacoemulsification. The study is based on evaluation of following outcome variables:
Primary outcome variables: –
1.UCVA and BCVA at 4 weeks in Femtosecond laser cataract group and Control group.
2.Specular microscopic endothelial counts pre-operative vs post-operative at 4 weeks.
3.Pachymetry pre-operative vs post-operative at 4 weeks.
4.Fluid used intraoperatively in both the groups.
5.Mean absolute error between both the groups.
6.Comparison of incidence of complication.
7.Wound integrity as assessed by Seidel’s test after the surgery in both the groups
Secondary outcome variables: –
1.Comparison of AC depth preoperatively vs preoperatively in both the groups.
2.Comparison of circularity of the capsulorhexis.
3.Comparison of capsular overlap over the edge of the IOL optic.
4.Comparison of de-centration of the IOL.
5.Comparison of effective phacoemulsification time.
MATERIALS AND METHODS
The study is aimed at comparison of Femtosecond laser assisted cataract surgery and standard 2.2 mm clear corneal Phacoemulsification conducted over a period of two years in Prabha Eye Clinic and Research Center, Bangalore.
Inclusion criteria
Patients with visually significant cataract undergoing cataract surgery.
Exclusion criteria
Patients with co-existent retinal pathology, glaucoma, non-dilating pupils, subluxated lens/zonular weakness, with pre-operative endothelial counts less than 2000 cells/mm2
Study group
55 eyes of 55 patients undergoing FLACS
Control group
55 eyes of 55 patients who were matched for grade of cataract with study group and recruited prospectively, after fulfilment of inclusion and exclusion criteria and undergoing 2.2 mm clear corneal phacoemulsification.
Both surgeries of study and control group was done by the same surgeon.
Preoperative documentation
1.BCVA as assessed by Snellen’s chart
2.Grade of cataract as per the LOCS III classification
3.Fundus examination
4.Biometry with third generation formulas
5.Specular microscopy: To record endothelial cell count and pachymetry
6.Slit lamp photograph – Retro illumination and slit
Intraoperative documentation
Effective phaco time, Volume of Fluid consumed and any complications during the surgery were recorded.
Postoperative documentation
Seidel’s test was done at the end of procedure, at end of one hour of surgery and at first postoperative day.
At first postoperative day, visual acuity and anterior segment examination of the operated eye in both procedures was assessed.
At postoperative 4th week, in both procedures, following were assessed:
1.UCVA
2.BCVA
3.Anterior segment examination
4.Residual refractive error: It was analyzed using the mean absolute error, MAE, i.e. the difference between predicted and achieved postoperative spherical equivalent refraction.
5.Documentation of AC depth by Lenstar / Pentacam.
6.Specular microscopy: To assess endothelial cell count and pachymetry
7.Dilated slit lamp retro illuminated photograph of the patient to assess circularity of capsulorhexis, capsular overlap and de-centration of IOL
Digital retro-illumination photographs were taken 4 weeks after surgery with dilated pupils. Photos were imported into Adobe Photoshop CC 2014 version (Adobe Systems Inc., San Jose, California) to measure the circularity, capsular overlap over the edge of the IOL and decentration of the IOL. The above parameters were measured in Adobe Photoshop in following way:
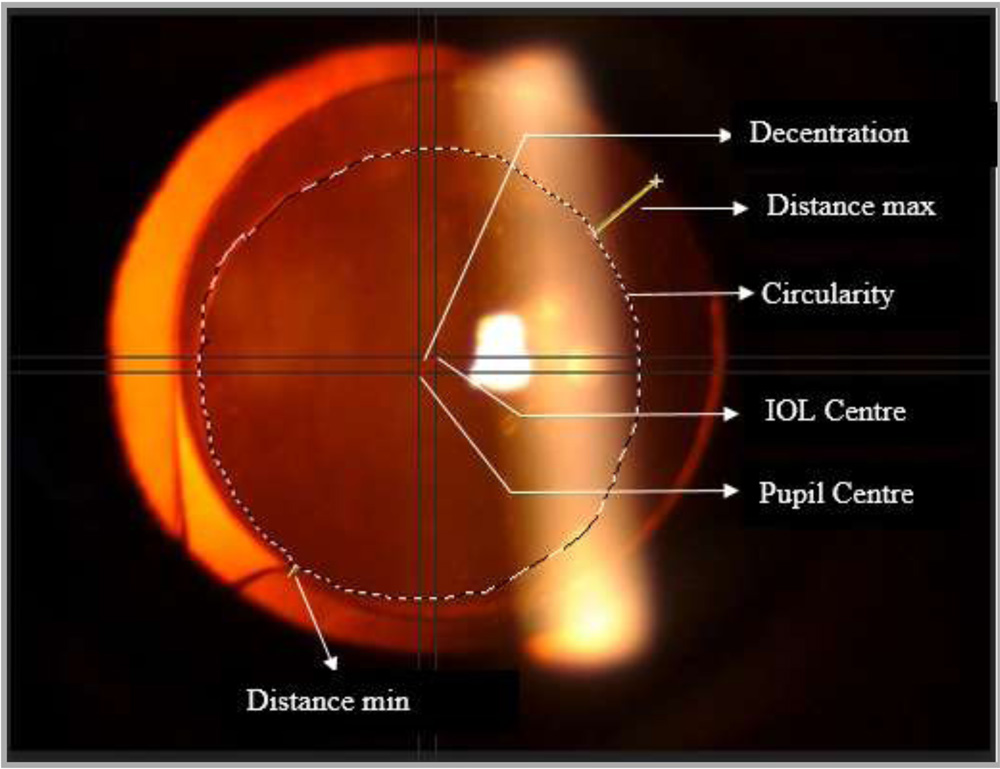
Circularity
Circularity is a parameter used to determine the regularity of the shape of the capsulotomy according to the following formula: Circularity=4π X (area/perimeter2). Values of 1.0 indicate a perfect circle/superior circularity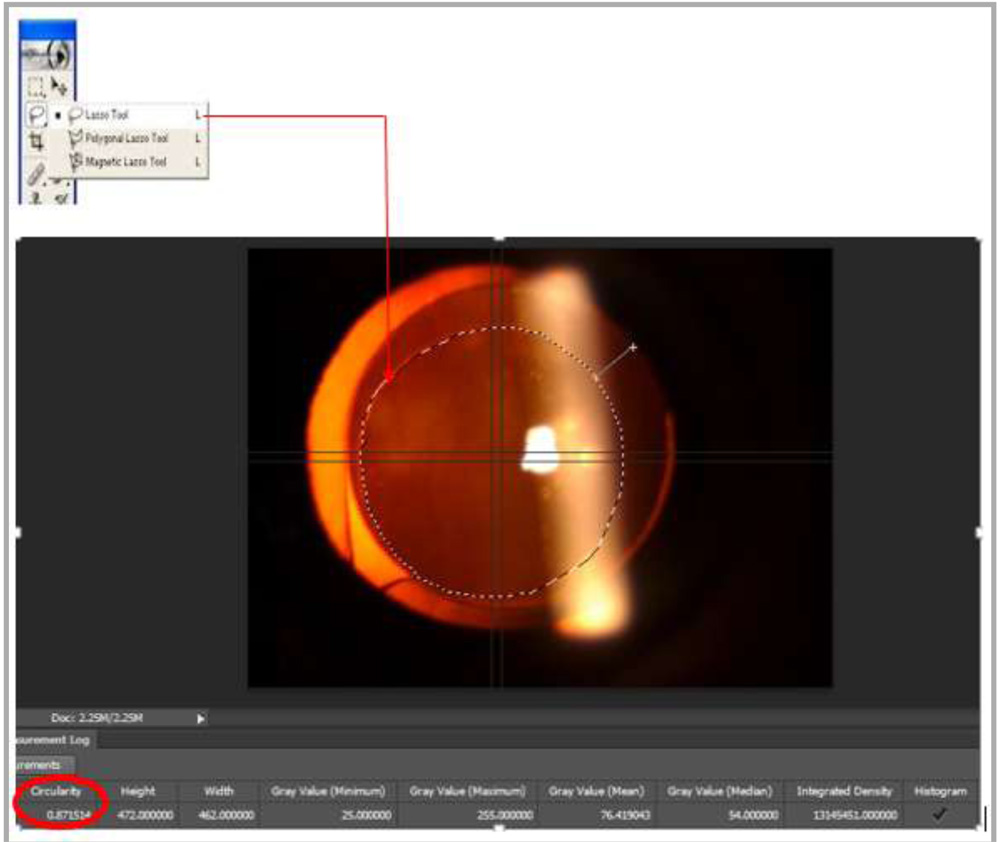
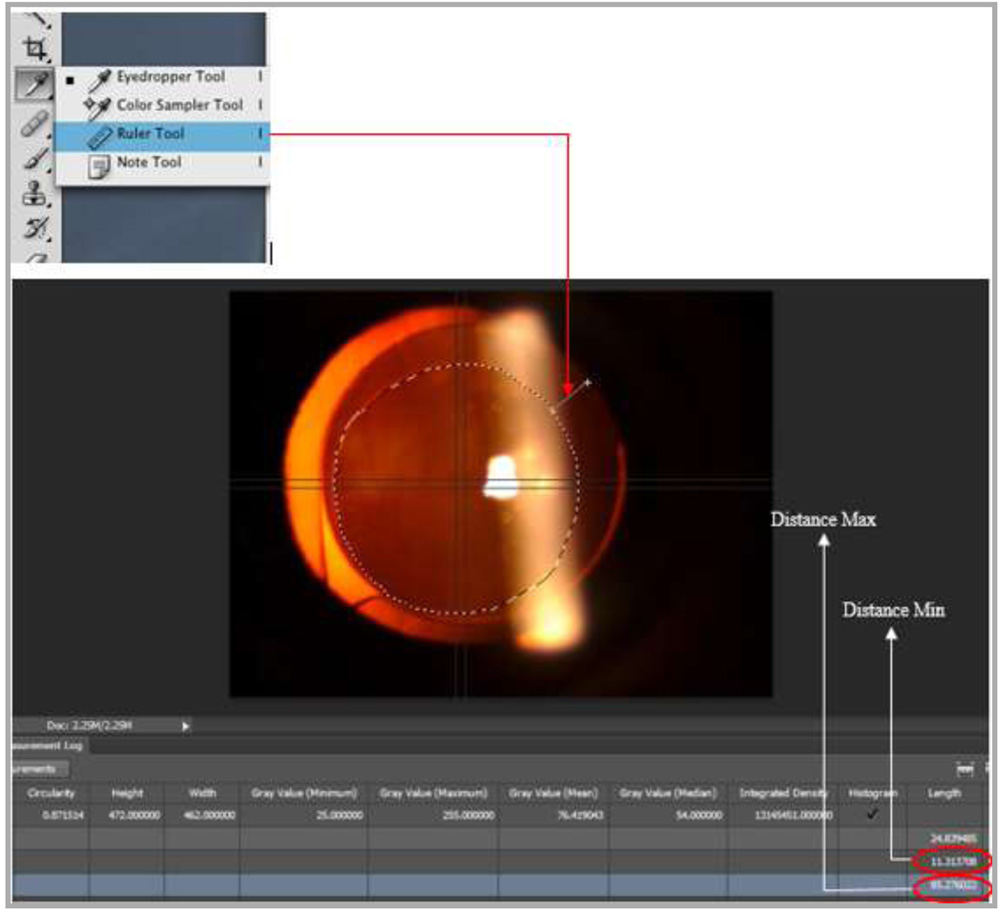
Capsular overlap
It was evaluated whether the capsulotomy shows uniform overlap over the edge of the IOL optic. Capsular overlap is the ratio of the shortest and longest distance between the edge of the capsulorhexis and the edge of the IOL optic. (Distance Min/Distance Max). A value close to 1 indicates a superior capsular overlap.
De-centration of IOL
De-centration of IOL is the distance from centre of pupil to centre of optic of IOL. It is measured in dilated pupil.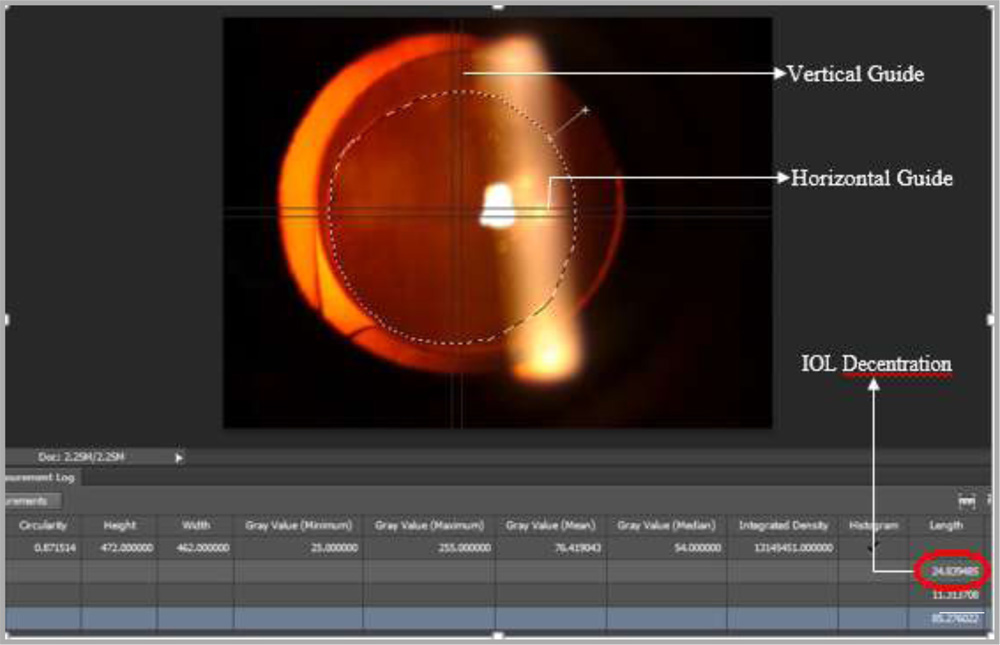
Statistical Tools
The study was analysed using analytical and descriptive statistics. Statistical software used for analysis was MINITAB Release 14 Statistical Software. For all statistical tests, the significance was taken as p<0.05.
RESULTS AND ANALYSIS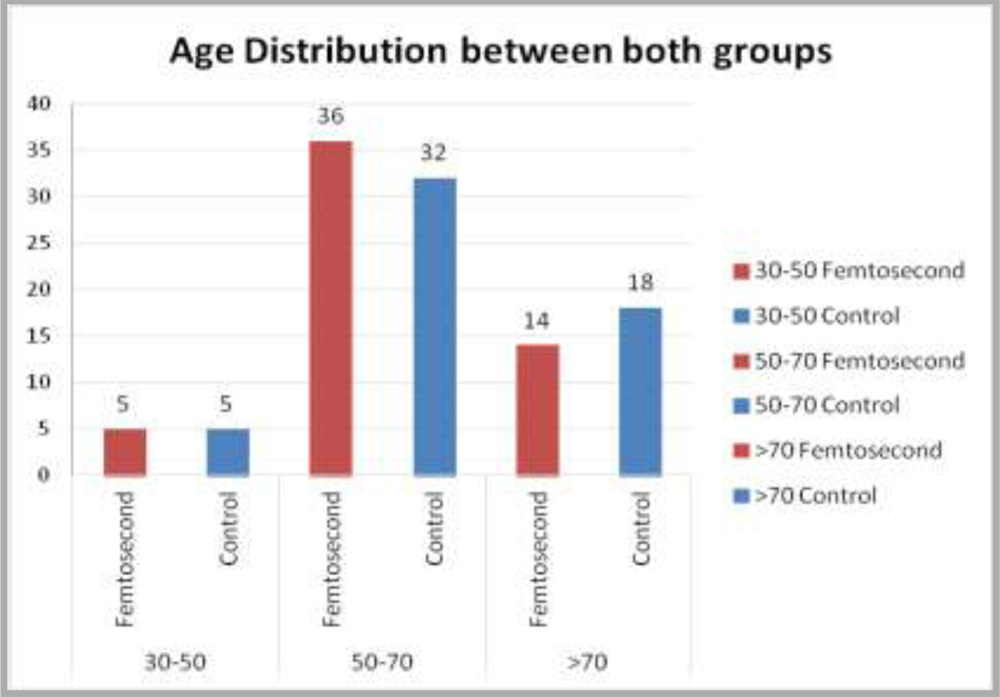
Graph 1
Primary outcome variables
a) UCVA at 4 weeks
Table 1: Comparison of Uncorrected Visual Acuity (UCVA) at 4 weeks
| Median (Snellen equivalent) |
Mean±SD | |
| UCVA 4 Weeks (Femtosecond) | 0.176(6/9) | 0.2127±0.1972 |
| UCVA 4 Weeks (Control) | 0.176(6/9) | 0.2337±0.1465 |
Data was not normally distributed in both the groups and Mann Whitney test was conducted to compare the UCVA at 4 weeks.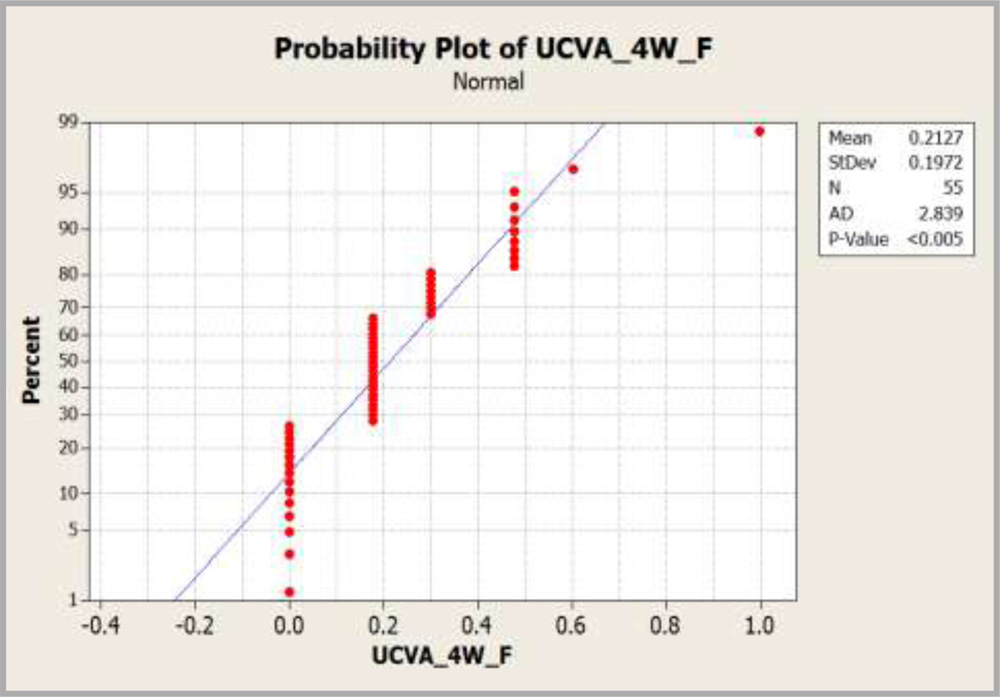
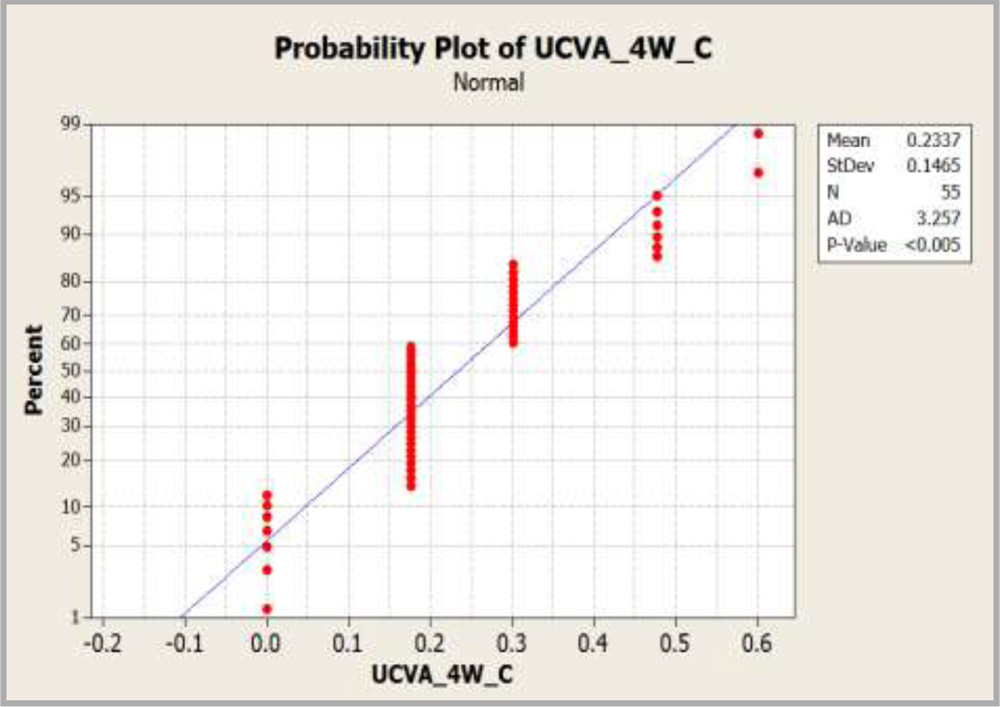
Graph 3 : Graph showing comparison of UCVA at 4 weeks.
It was found that there was no significant difference between the UCVA at 4 weeks in both the groups as p-value was 0.2548.95% confidence interval for the difference in UCVA after 4-weeks was found to be varying between 0 to 0.1250.
a) BCVA at 4 weeks
Table 2: Comparison of Best corrected visual acuity (BCVA) at 4 weeks
| Median (Snellen equivalent) |
Mean±SD | |
| BCVA 4 Weeks (Femtosecond) | 0(6/6) | 0.0648±0.1018 |
| BCVA 4 Weeks (Control) | 0.176(6/9) | 0.1069±0.1133 |
Mann Whitney test was conducted between both the groups as the data distribution was not normal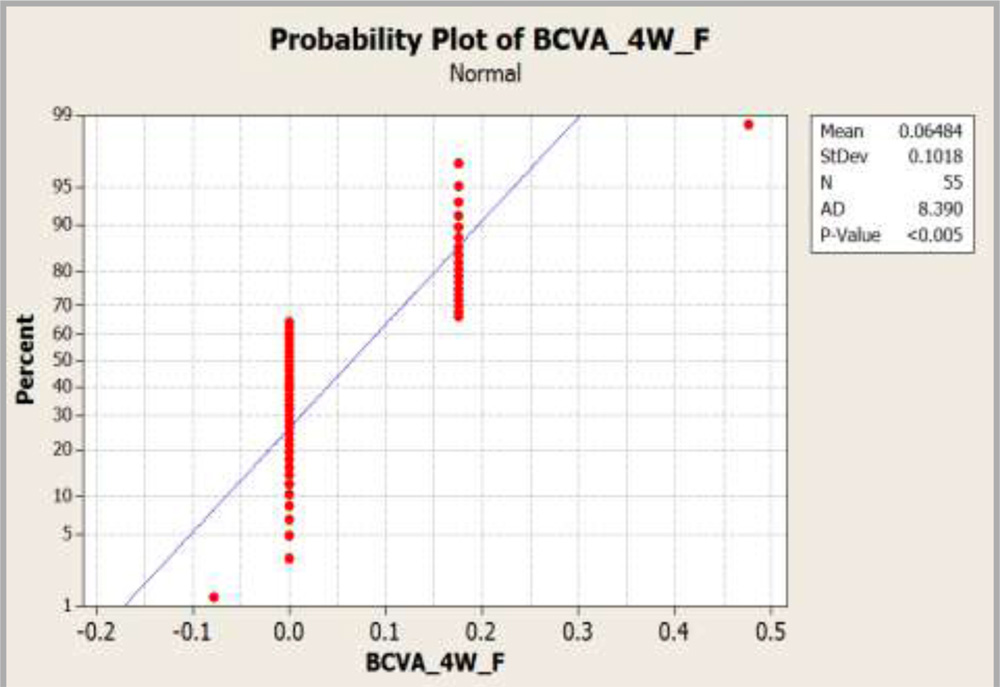
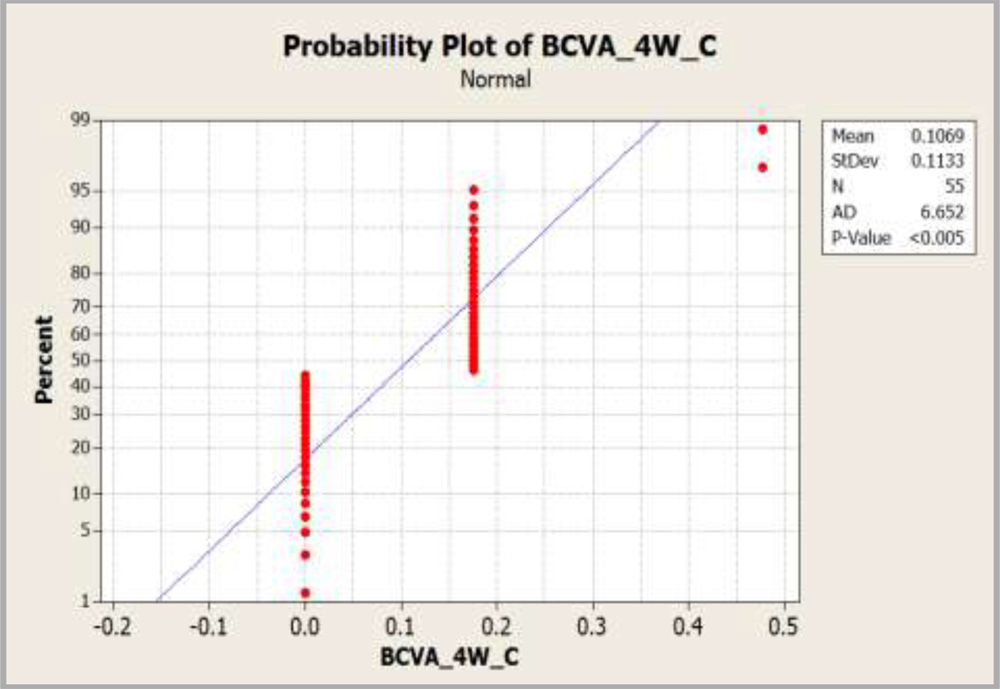
Graph 4:Graph showing comparison of BCVA at 4 weeks.
It was found that BCVA at 4 weeks was statistically significant between both the groups (p = 0.0294). We may conclude that BCVA in the femtosecond group was better than BCVA in the control group at 4 weeks with 95% confidence interval (-0.00001, 0.00002)
a) Specular microscopic endothelial count at 4 weeks
Table 3: Comparison of Specular microscopic endothelial counts pre op vs post op
| Mean±SD-PreOp | Mean±SD-4W | Mean change in cell density | % decrease in mean cell count | |
| Cell Density Femtosecond |
2307.9±246.3 | 1975.6±323.7 | 332 | 14.4 |
| Cell Density Control |
2310.3±223.7 | 2073.7±236.6 | 237 | 10.2 |
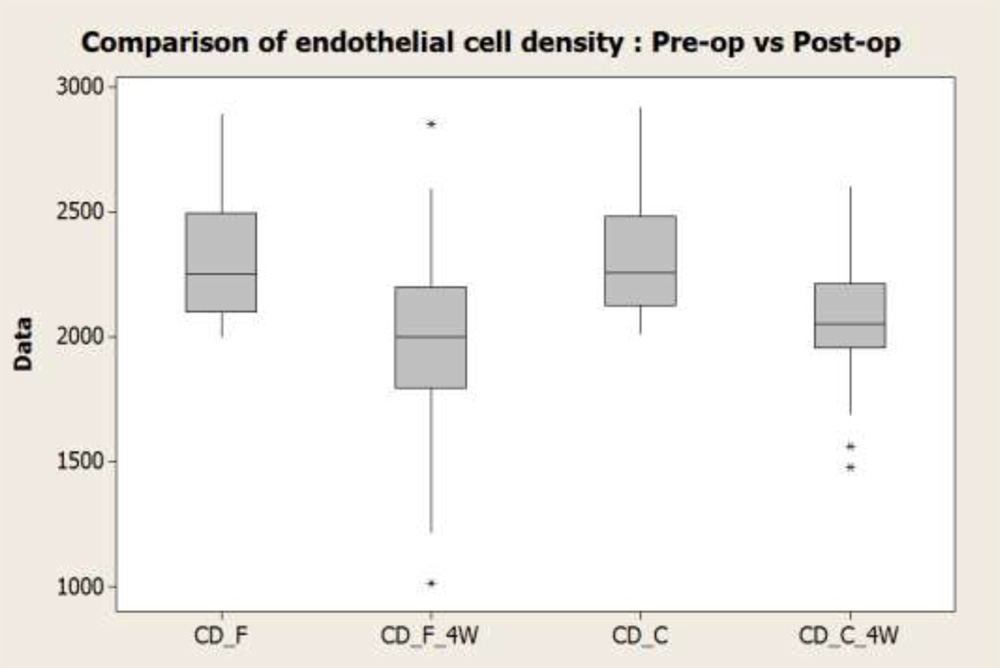
Graph 5
Post-operative endothelial counts decreased in both the groups.
Sample t test was conducted between the groups to compare the postoperative decrease in the endothelial cell count in both the procedures to know which group produced more decrease in specular microscopic endothelial count.
It was found that the cell density decreased more in the femtosecond group (4.2 % more) than in the control group as shown in the table above (p=0.032)
a) Pachymetry
Table 4: Comparison of Pachymetry pre op vs post op
| Mean±SD
(Pre-op) |
Mean±SD
(4W) |
Minimum
(Pre-op) |
Maximum
(Pre-op) |
Minimum
(Post-op) |
Maximum
(Post-op) |
|
| Femtosecond | 571.71±41.23 | 575.45±49.24 | 462 | 677 | 441 | 685 |
| Control | 567±31.29 | 571.04±32.48 | 500 | 648 | 490 | 660 |
Paired t test was conducted in each group to compare pre-operative vs post-operative (4 weeks) pachymetry.
It is found that there is no significant increase in the post-operative pachymetry values in each group as p- value was 0.784 in femtosecond group and p value was 0.845 in the control group as shown in the graph below: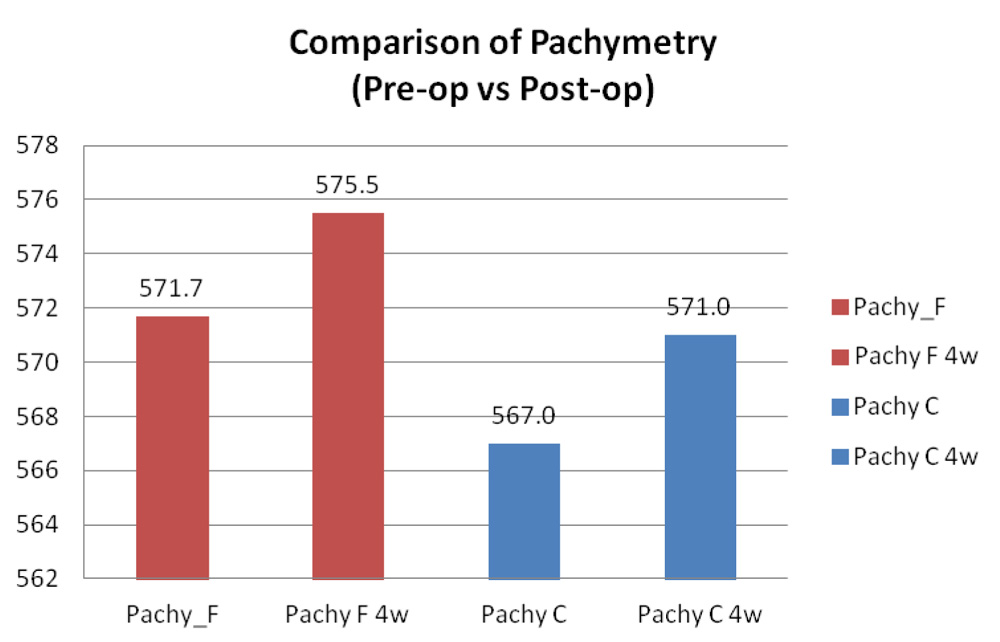
Graph 6
a) Irrigating Fluid (BSStm) consumed intraoperatively
Table 5: Comparison of Fluid used intraoperatively
| Fluid consumed | Mean±SD | Minimum | Maximum |
| Femtosecond | 153.31±68.52 | 71 | 409 |
| Control | 168.3±74.9 | 61 | 373 |
The amount of fluid which was consumed intra operatively for cataract surgery in both the groups was compared using two sample t test.
It was found that there is no significant difference in the fluid consumption in both the procedures (p=0.277) as shown in the pie chart below:
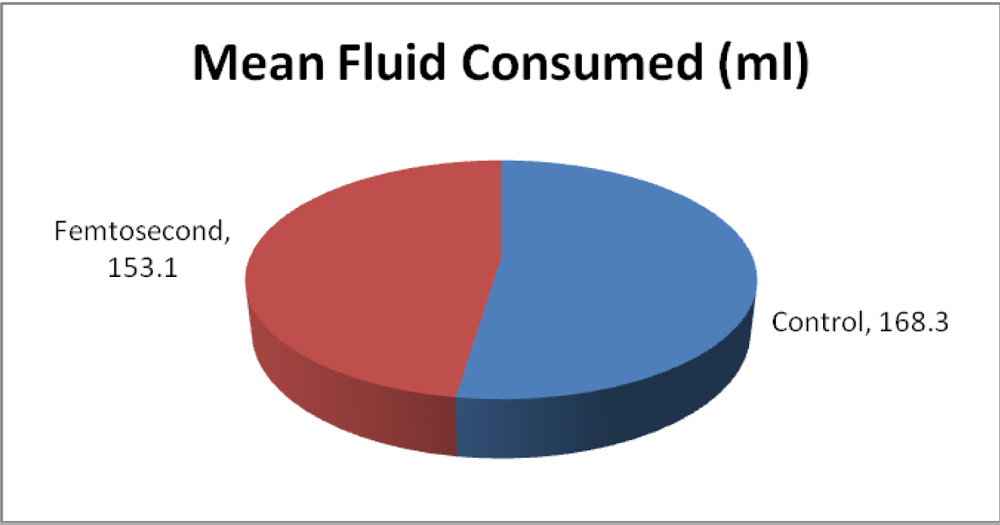
Graph 7: Comparison of fluid used intraoperatively.
a) Mean absolute error
Table 6: Comparison of Mean absolute error (MAE)
| Mean±SD (Predicted) |
Mean±SD (Actual) |
MAE | |
| Femtosecond Refractive error (in Diopters) | 0.0909±0.1383 | 0.2977±0.3085 | 0.2068±0.355 |
| Control Refractive error (in Diopters) | 0.0885±0.0503 | 0.2359±0.3157 | 0.14735±0.327 |
Wilcoxon Signed Rank test was conducted for both the groups to compare the predicted refractive error from the achieved refractive error in each group.
It was found that actual refractive error was deviating away from the predicted value in both the groups (In Femtosecond group at p=0, In Control group at p=0.004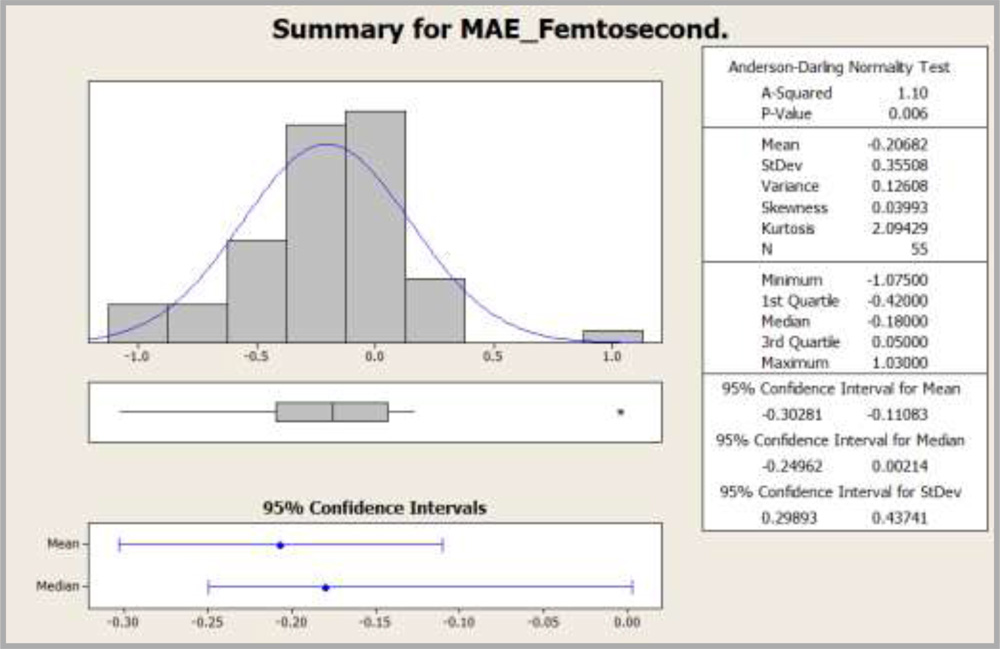
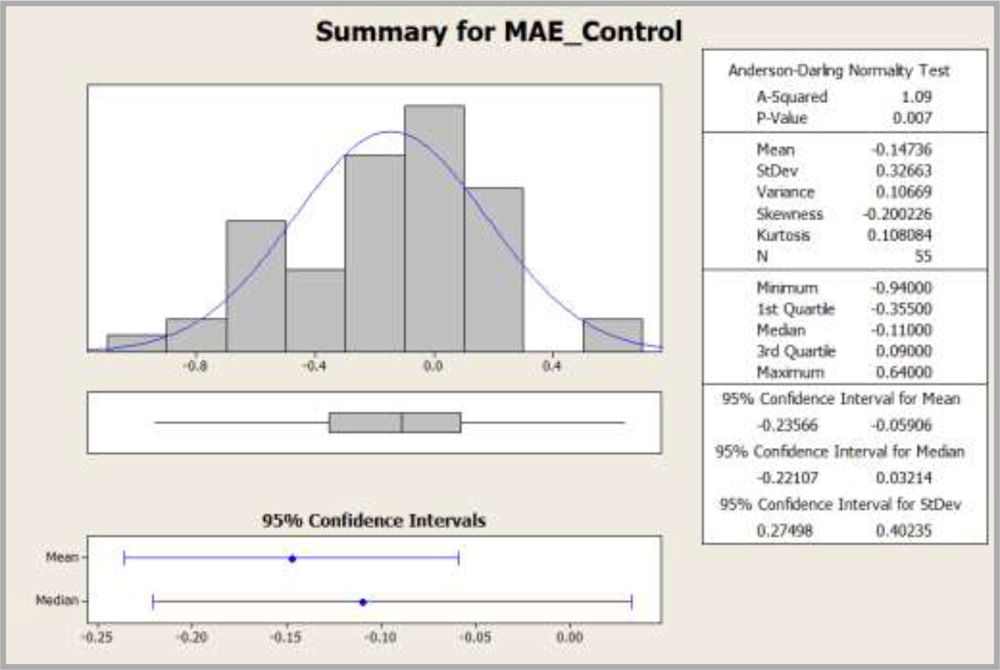
Graph 8: Histogram showing distribution of MAE
Since the data was not normal, Mann-Whitney test was conducted on MAE between the groups to compare the residual refractive error. It was found that there is no significant difference in MAE between both the groups as p value was 0.3051 with 95% confidence interval (-0.1700, 0.0400) as shown in the box plot below: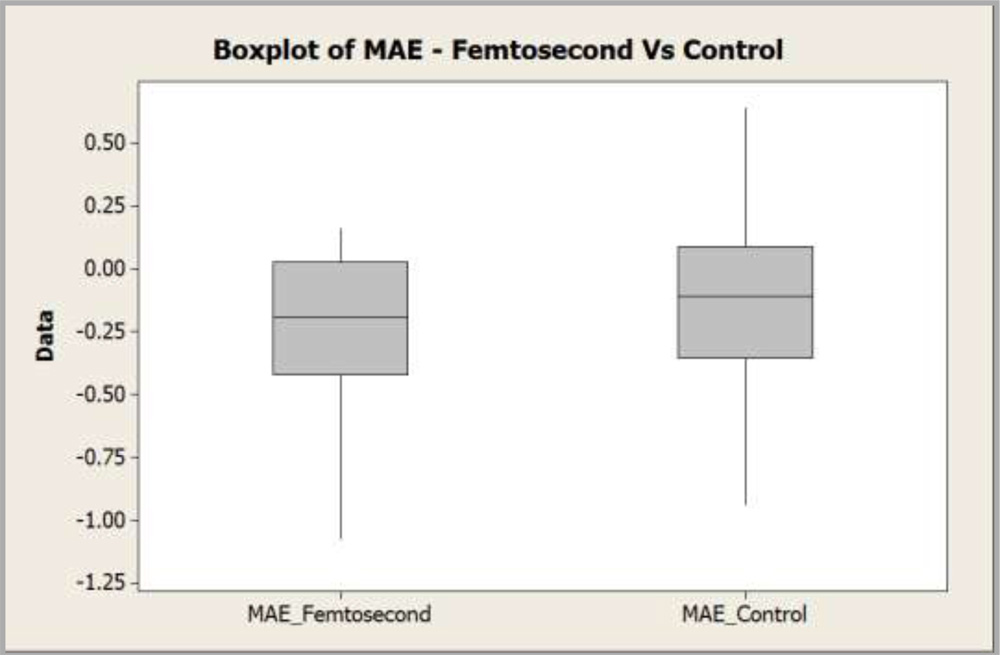
.Graph 9
a) Comparison of incidence of complications like posterior capsular rent, capsulorhexis run off and nucleus drop
Chi square test was done to compare the incidence of complications in both the groups.
It was found that the incidence of complications is independent of the method of surgery as p value was 0.647
b) Wound integrity
There was no need to perform statistical analysis for wound integrity as there was no wound leak found in any of the patients in our study.
Secondary outcome variables
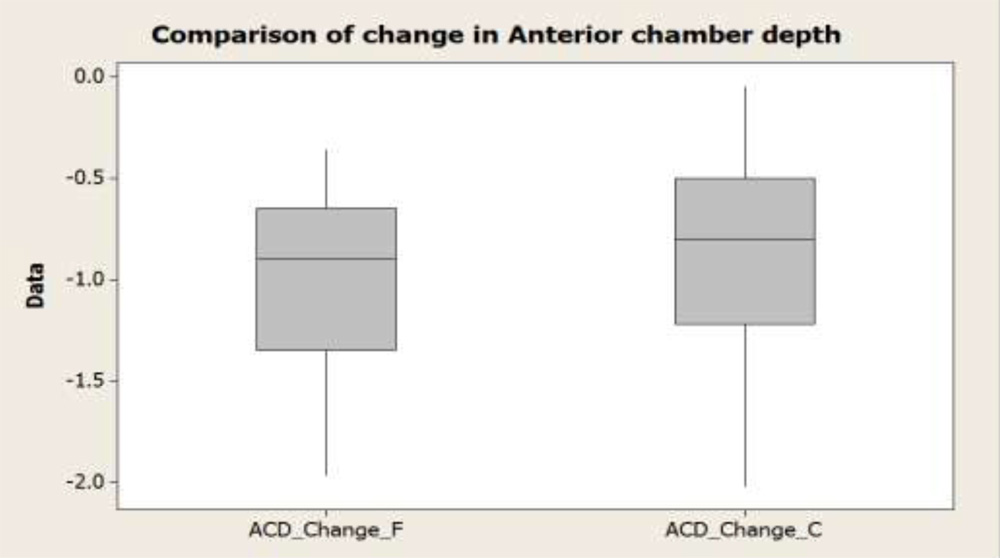
a) Anterior Chamber Depth
Table 7: Comparison of Anterior chamber depth (ACD) before and after surgery
| Mean±SD | Minimum | Maximum | |
| *ACD_Diff_Femtosecond(mm) | -0.9795±0.4074 | -1.97 | -0.36 |
| *ACD_Diff_Control (mm) | -0.9122±0.4690 | -2.02 | -0.05 |
*ACD_Diff_Femtsecond: The difference in the ACD before and after femtosecond cataract surgery
*ACD_Diff_Control : The difference in the ACD before and after manual cataract surgery
The preoperative and postoperative ACD was recorded in both the procedures.
Two Sample t test was done between both the groups to compare anterior chamber depth before and after surgery.
The change in the anterior chamber depth was not statistically significant (p=0.829) in both the groups as shown in the boxplot below
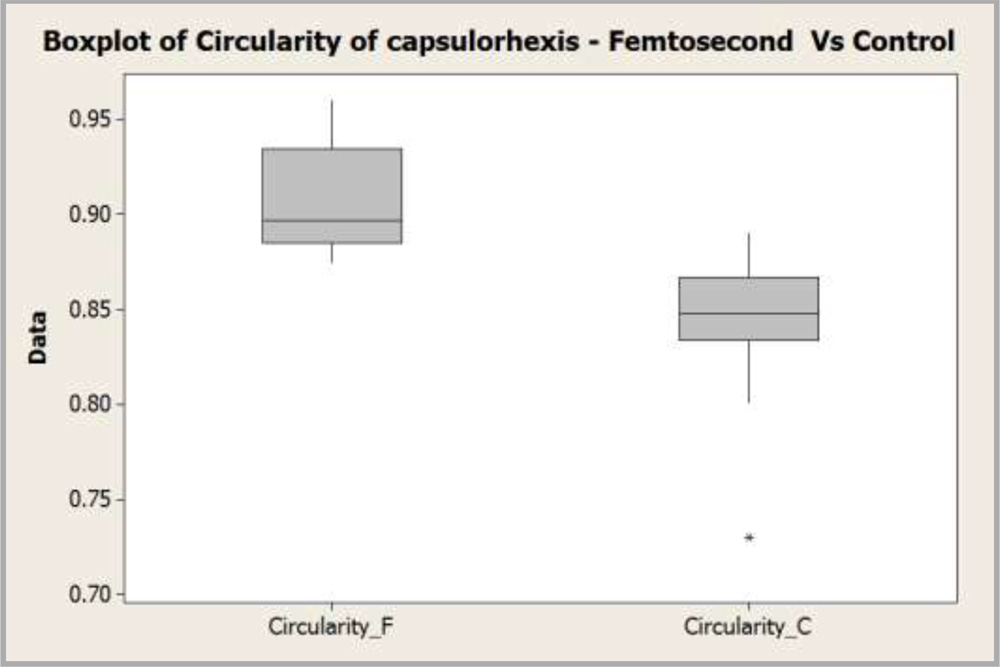
a) Circularity of capsulorhexis
As evident in the table below, the mean circularity in the femtosecond group is superior as compared to the control group because circularity in femtosecond group is closer to 1
Table 8: Comparison of circularity of capsulorhexis.
| Mean±SD | |
| Circularity(Femtosecond) | 0.9082±0.0277 |
| Circularity(Control) | 0.8482±0.0261 |
ANOVA (Analysis of variance) was done between the groups to compare the circularity.
It was found that there is a significant difference in the circularity of capsulorrhexis between both procedures (p=0). It was superior in femtosecond group as shown in the box plot below:
Graph 11
a) Capsular Overlap over the edge of IOL
Value of 1 indicates an absolute regularly overlapping anterior capsule on the optic of the implanted IOL.
ANOVA was done between the groups to compare the capsular overlap over the edge of IOL.
It was found that there is significant difference in the circular overlap over the edge of IOL between two procedures (p=0)
As evident in the table below, the mean overlap in the femtosecond group is superior as compared to the control group because it is closer to 1.
Table 9: Comparison of capsular overlap over the edge of IOL.
| Mean±SD | |
| Overlap_Femtosecond | 0.371±0.102 |
| Overlap_Control | 0.263±0.137 |
a) De-centration of IOL
Table 10: Comparison of decentration of IOL
| Mean±SD | Minimum | Maximum | |
| Decentration_Femtosecond
(in pixels) |
17.361±6.069 | 6 | 31.401 |
| Decentration_Control
(in pixels) |
20.581±4.608 | 0 | 27.803 |
ANOVA was done to compare decentration of IOL in both the procedures.
It was found that the analysis was statistically significant (p=0.002). As shown in the table above, decentration in the femtosecond group was less as compared to the control group.
a) Comparison of effective phaco time in both the procedures
For analysing the effective phaco time in both the procedures, in all grades of nuclear cataract, the sample size was divided into 3 cataract groups. This was done based on the LOCS classification of nuclear sclerosis (Nuclear opalescence NO1-NO6, Nuclear colour NC1-NC6).
Cataract Group 1 includes NO1 NC1 to NO2.9 NC2.9
Cataract Group 2 includes NO3 NC3 to NO4.9 NC4.9
Cataract Group 3 includes NO5 NC5 and NO6 NC6
Table 11: Distribution of patients in the cataract groups
| Cataract Groups | Femtosecond | Control | Grand Total | % Femtosecond | % Control |
| Cataract Group 1 | 13 | 4 | 17 | 24% | 7% |
| Cataract Group 2 | 29 | 33 | 62 | 53% | 60% |
| Cataract Group 3 | 13 | 18 | 31 | 23% | 33% |
| Grand Total | 55 | 55 | 110 | 100% | 100% |
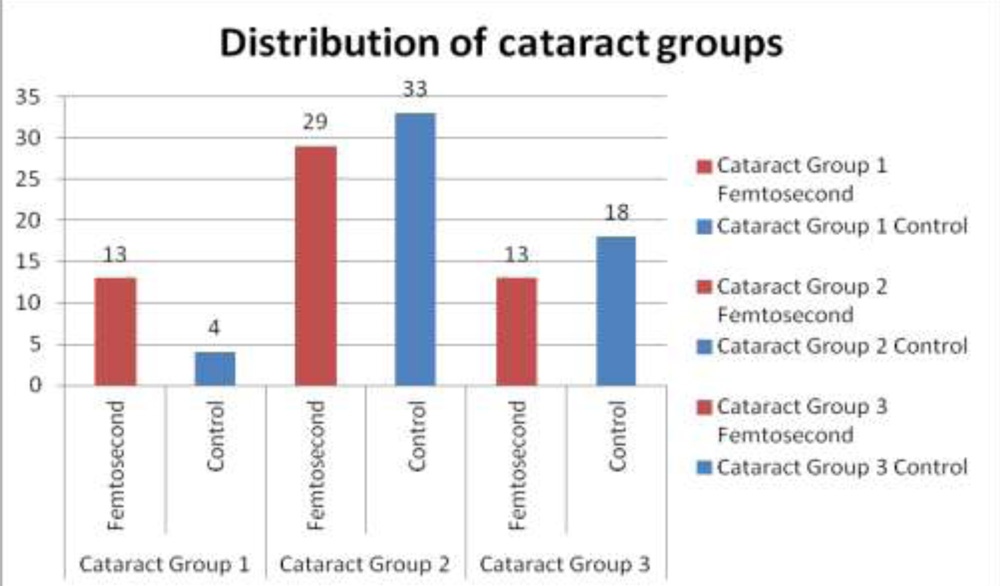
Graph 12
Effective phaco time was recorded in both the procedures
General Linear Model was used for analysis and it was found that there was significant difference in the phaco time used in both the procedures. (p=0).
Table 12: Comparison of effective phacoemulsification time.
| Mean ± SD (in sec) | |
| Phaco time(Femtosecond) | 49.61±38.87 |
| Phaco time(Control) | 96.43±65.36 |
It was found that femtosecond group utilizes less phaco time for similar grade of nuclear sclerotic cataract as compared to control group as shown in the multivariate chart below: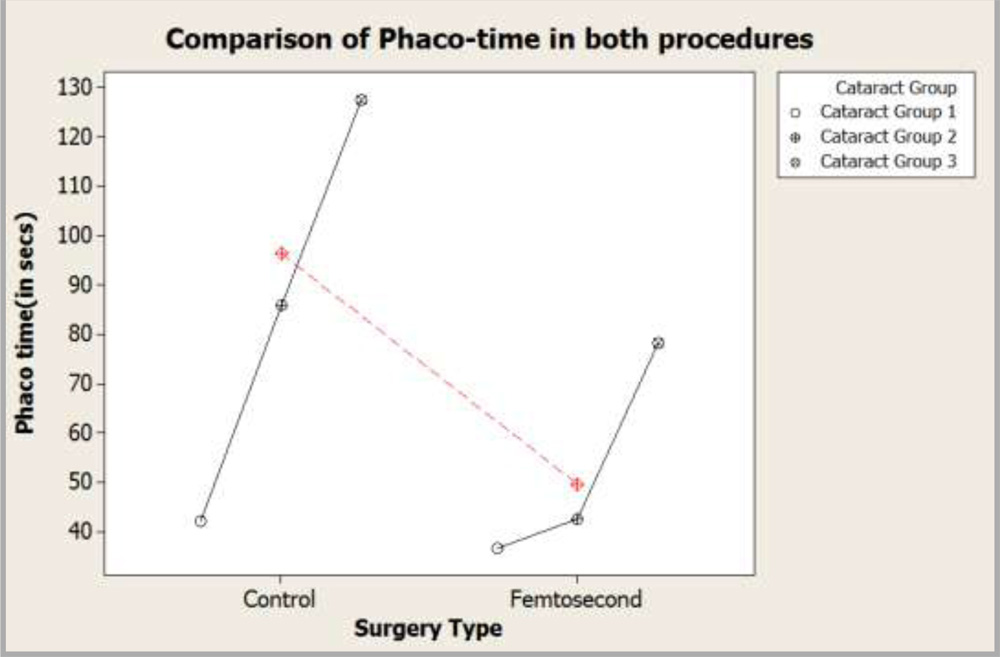
Graph 13: Multivariate chart showing comparison of effective phaco-time.
We would like to thank Mr.Haridas Acharya , Professor, Indian Statistical Institute, Bangalore, for his sincere effort and guidance towards this study.
DISCUSSION
Our study showed that the two procedures were similar when UCVA was compared but the outcomes of BCVA at 4 weeks was found to be better in the femtosecond group. The amount of difference and statistical significance however is not very high (p=0.0294). ESCRS study on long term clinical outcome after femtosecond cataract surgery also showed only a slightly better mean postoperative BCVA in the femtosecond group.2(96.37% vs 93.55% achieving 6/12 or better, p = 0.07)
The specular microscopic endothelial counts were decreased postoperatively for both the groups but the percentage of cell loss in the femtosecond group was found to be higher (14.4 % cell loss in the femtosecond group and 10.2 % in the control group, p=0.032) as compared to the control group. This slightly higher endothelial cell loss in the femtosecond group in our study may be due to the following factors: –
1.The fact that the incisions in the laser group tend to be more corneal, could have caused the drop in the central endothelial cell count due to turbulence of the fluid. The extent to which corneal incisions were into clear corneal from the limbus have not been analysed in our study.
2.Jong Hwa Jun et al3 concluded in their study that the pupil area decreased significantly after femtosecond laser pre-treatment of cataract surgery. The intracameral use of adrenaline in patients with miotic pupil could have caused the loss of corneal endothelial cells in the femtosecond group.
Although the endothelial cell count had decreased postoperatively, it was seen that pachymetry was not significantly affected between both the groups. This shows that the reduction in the endothelial count in both groups was not significant.
In our study, there was no significant difference in the MAE between the femtosecond and the control group. In a study did by Tamas Filkorn et al4 at 6 weeks after surgery, MAE was significantly lower in the femtosecond group as compared to the control group(p=0.04). This difference is possibly due to more precise capsulorrhexis , resulting in more stable IOL position.
Intraoperatively, both the groups did not have any significant difference in the incidence of complications. Robin G Abell et al5also had similar results in their study.
The change in the anterior chamber depth postoperatively is a surrogate for lens positioning. In our study, it was found that both the procedures did not have any significant difference in the anterior chamber depth change postoperatively. We could therefore infer that effective lens position post operatively would be similar in the two groups.
The findings in our study and other published reports do substantiate the fact that femtosecond cataract surgery results in a more consistent capsulorrhexis, and IOL centration with more ideal overlap of rhexis margin over the IOL. This fact could also have contributed to the better BCVA in the femtosecond group.
The overall mean effective phacoemulsification time was significantly lower in femtosecond group (49.61±38.87 secs) as compared to the control group (96.43±65.36 secs) for similar grade of cataract. ESCRS study2 also showed that effective phacoemulsification time was reduced by 85% in the Femtosecond.As stated in ESCRS study2, at current cost to patients and utilizing real comparative cohort data, femtosecond laser pre-treatment does not represent a cost-effective addition to conventional phacoemulsification (≈$3500 AUD cost/QALY for Conventional Phacoemulsification) We in our study, have not done the cost effectiveness analysis of the femtosecond laser pre-treatment.
We have also not included the fidelity of the corneal incision as a variable to be studied. The number of times a corneal incision failed to open or was placed in a position which was different than where it was intended could be studied and we feel that this aspect needs to be improved in femtosecond laser.
CONCLUSION
The femtosecond laser assisted cataract surgery is probably a better alternative as compared to manual cataract surgery. BCVA is superior in the femtosecond cataract surgery although the difference of significance is not very high. Thesecondary outcome variables are definitely superior in the femtosecond group and hence may translate into a better visual outcome for the patient. What difference the increase in BCVA makes to the quality of life and vision for the patient and if this justifies the extra expense associated with femtosecond laser cataract surgery, needs to be studied further.
REFERENCES:
1.Gerard Sutton, Shveta Jindal Bali, Chris Hodge. Femtosecond cataract surgery. Trasitioning to laser cataract. Current opinion in ophthalmology 2013; 24(1): 3-8.
2.Vote, S Eve, R Abell, P Allen, N Kerr, A.Howie, et al. Long term clinical outcomes after femtosecond laser assisted cataract surgery: results from a multicentre prospective comparative cohort study. Poster presented at : XXXII Congress of the ESCRS; 2014 Sep 13 ; London, UK
3.Jong Hwa Jun, Kyu Yeon Hwang, Sung Dong Chang, Choun-Ki Joo. Pupil-size alterations induced by photodisruption during femtosecond laser-assisted cataract surgery. J cataract refract surg. 2015 Feb; 41(2):278-285.
4.Filkorn T, Kovacs I, Takacs A, Horvath E, Knorz MC, Nagy ZZ. Comparison of IOL power calculation and refractive outcome after laser refractive cataract surgerywith a femtosecondlaser versus conventional phacoemulsification. J Refract Surg 2012 Aug; 28(8):540-4.
5.Robin G Abell, Nathan M Kerr, Brenden J Vote. Femtosecond laser-assisted cataract surgey compared with conventional cataract surgery. Clinical & Experimental Ophthalmology. 2013 July; 41(5):455-462. ->5
LIST OF ABBREVIATIONS
1.UCVA_4W_F Uncorrected visual acuity at 4 weeks in femtosecond group.
2.UCVA_4W_C Uncorrected visual acuity at 4 weeks in control group.
3.BCVA_4W_F Best corrected visual acuity at 4 weeks in femtosecond group
4.BCVA_4W_C Best corrected visual acuity at 4 weeks in control group
5.CD_F Preoperative cell density in femtosecond group.
6.CD_C Preoperative cell density in control group.
7.CD_F_4W Postoperative cell density in femtosecond group at 4 weeks.
8.CD_C_4W Postoperative cell density in control group at 4 weeks.
9.MAE_Femtosecond Mean absolute error in femtosecond group
10.MAE_Control Mean absolute error in control group.
11.ACD_Change_F Anterior chamber depth change in femtosecond group.
12.ACD_Change_C Anterior chamber depth change in control group
13.Circularity_F Circularity of capsulorhexis in femtosecond group.
14.Circularity_C Circularity of capsulorhexis in control group.
15.Overlap_Femtosecond Capsular overlap over the edge of IOL in femtosecond
16.Overlap_Control Capsular overlap over the edge of IOL in control group.
17.Decentration_Femtosecond Decentration of IOL in femtosecond group.
18.Decentration_Control Decentration of IOL in control group.
19.Phaco_Time Effective phacoemulsification time.
20.Phaco_Time Effective phacoemulsification time.