Dr.Pramod Kumar Upadhyay, K09659, Dr. Mehul Ashvin Kumar Shah, Dr. Romi Singh, Dr. Ashit Hasmukhlal Shah
PURPOSE:
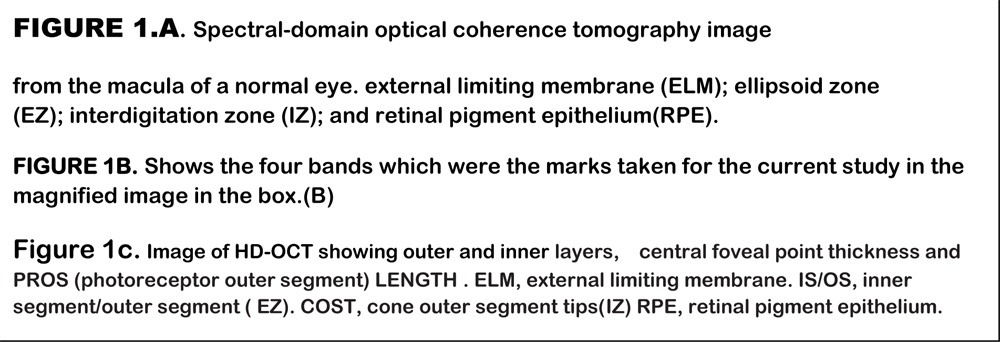
To evaluate the significance of photoreceptor outer segment layer length status using Spectral Domain Optical Coherence Tomography (SD-OCT), in predicting visual outcome in patients undergoing treatment for macular edema due to retinal vascular diseases.
Methods:
Data and images of 60 eyes of 60 patients with macular edema due to diabetes mellitus, branch retinal vein occlusion, treated with either bevacizumab or, ranibizumab were analyzed. All patients underwent best-corrected visual acuity measurement, slit-lamp examination, spectral domain optical coherence tomography at baseline and at all time points of the follow-up (day 21, month 1, 2, 3).
Results:
There was clinicallyno significant difference in change in best-corrected visual acuity when we compared withPROS lengthin our cohort of patient with retinal vascular disease,P=0.32. Visual outcome following intervention was statistically significant (P<0.000).
Conclusion:
PROS Lengthis correlated to CDVA but statically was not significant in our study. Pre procedure and post procedure visual outcome was verysignificant statisticallyin patients with macular edema due to retinal vascular diseases.
INTRODUCTION:
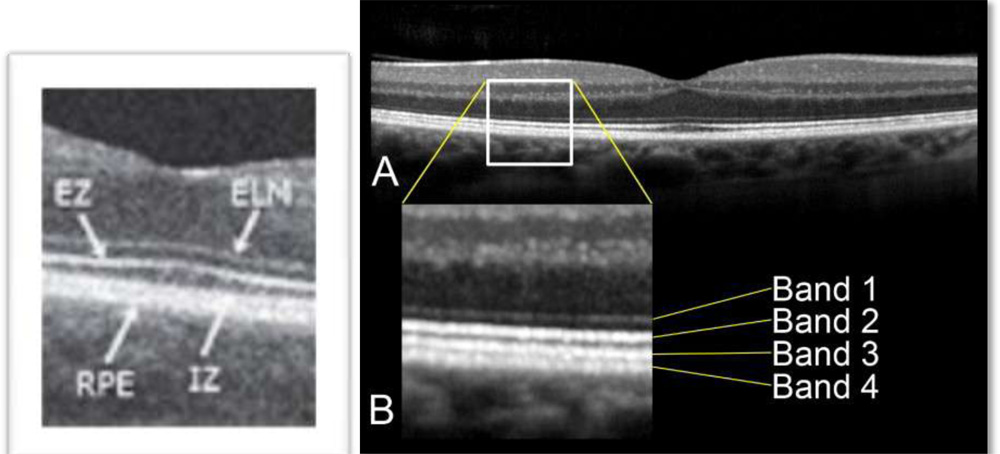
Diabetic retinopathy (DR), and retinal vein occlusion are the most common retinal vascular diseases, and macular edema (ME) is the most common cause of visual impairment in people with these clinical entities.1–3 The advancement in optical coherence tomography (OCT) technologies including the increase in speed of scanning and higher axial resolution (around 3 microns for certain OCT machines) has made visualization of the retinal microstructures possible. Reports have looked into the morphological changes happening in the outer retinal hyper-reflective bands
(Band 1 to 4) in subjects with various retinal diseases. The length of the photoreceptor outer segment (PROS) or outer retinal layer (ORL) has also been reported to be able to predict visual acuity in various retinal vascular diseases more accurately than the more commonly used macular thickness 14.
External limiting membrane is situated between cell nuclei of photoreceptors and their inner segments. The photoreceptor outer segment (PROS) or ORL thickness, as defined in this study as the distance between ELM and RPE, is therefore the sum of the length of photoreceptors inner segments and outer segments. It is known that photoreceptor outer segment contains disks filled with opsin, which is responsible for absorbing photons for later signal transduction. Therefore it is reasonable to deduce that if certain disease process damages photoreceptor and decreases the length of photoreceptor outer segment, vision would be compromised. This has already been proven to be true in DME by Forooghian 3 et al. On the other hand, the inner segment of photoreceptor is as important as the outer segment for cell functions because it is the reservoir of mitochondria; therefore it is responsible for the storage of ATP and thus for energy generation. Since both inner and outer segments of photoreceptors play an important role in the visual pathway, the change in ORL thickness should have important implications in visual potential. We believe this parameter can shed light on the overall health status of photoreceptors. Moreover, macular edema may be resolved but damage to photoreceptors does not; therefore a decrease in ORL thickness would be a more important visual prognostic factor than the total retinal thickness which may change over time.
Another important retinal segmentation noticeable on spectral (Fourier-domain) OCT, Cirrus™ 3.0, Carl Zeiss Meditec, Inc., Dublin, CA) the external limiting membrane (ELM), and its correlation with visual acuity in diabetic macular edema has not been well studied. Being situated between the cell nucleus and inner segments of photoreceptors, ELM may also be a possible OCT based parameter to be used indirectly in the assessment of photoreceptor functions. The aim of this study was to find out the correlation between visual acuity and the distance between the ELM and the retinal pigment epithelium (RPE), as a novel parameter in the assessment of ME.3-6
Material and method:
This study was performed in accordance to the tenets of the Helsinki Declaration. A written informed voluntary consent was taken from all the study subjects. All consecutive patients of retinal vascular disorders who sought consultations at retina services over one year period in this retrospective study which was conducted in a teaching tertiary care referral centre from 2015 to 2016 involving eyes from patients who had received various interventions in terms of intravitral injections of ranibizumab,bevacizumab at various interval during the course of their management.
- Inclusion criteria were diabetic patients aged 18 years or above and capable of giving consent and having macular edema due to DME, BRVO, CRVO, HRVO AS evidenced clinically with a slit lamp biomicroscopy or on OCT scans.
- Major exclusion criteria included poor media clarity that would affect vision and hinder satisfactory OCT image acquisition and presence of conditions that would affect macular thickness which were also excluded, such as age-related macular degeneration, vitreo-macular traction, epiretinal membrane, full thickness or lamellar macular holes, and other causes of macular edema. Eyes with subretinal fluid at fovea were excluded as well because their presence would result in falsely high measurement of outer retinal layers thickness (ORL thickness), since the distance is defined in this study as the distance between ELM and RPE. Others were:-
-
- Laser photocoagulation for ME ≤ 4 months prior to initiation of this study therapy
- Intraocular corticosteroid use ≤ 3 months prior to initiation of this study therapy
- History of anti-VEGF treatment (intravitreal ≤3 months prior to initiation of this study therapy, systemic ≤ 6 months prior to initiation of this study therapy)
- Stroke or myocardial infarction ≤ 3 months prior to initiation of this study
- Pregnancy or potential pregnancy, and breastfeeding
- Severe liver dysfunction, severe CKD/hemodialysis, uncontrolled DM (HbA1c>10), uncontrolled hypertension (BP≥ 160/100 mmHg)
Baseline demographics of patients were collected. Best-corrected visual acuity (BCVA) was measured with EDTRS study visual acuity chart.
A comprehensive ocular examination including dilated fundus slit lamp biomicroscopy and macular OCT scan were performed. If both of patient’s eyes were eligible for recruitment, they were used in the data analysis.
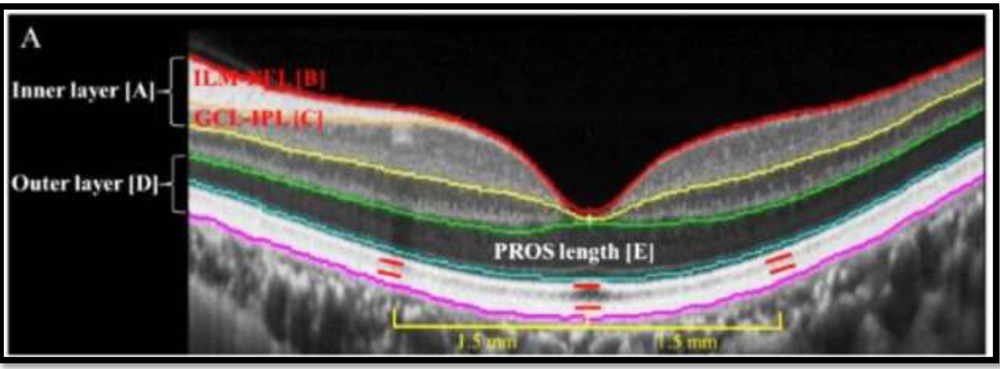
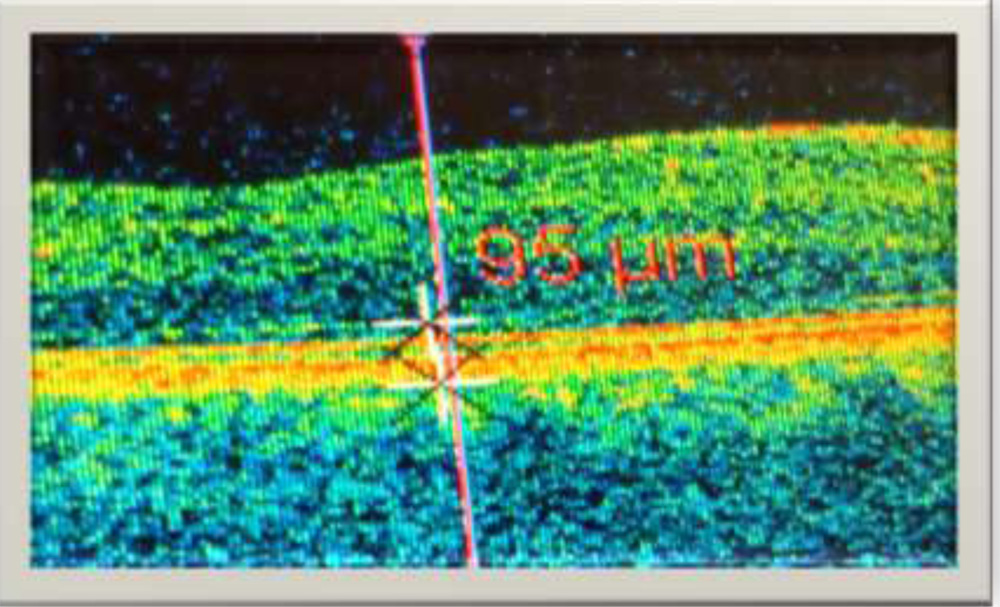
Determination of PROS Length was done by a retina specialist. The horizontal line scans crossing foveal centers of patients were chosen for analysis. The internal limiting membrane (ILM), ELM, and RPE segmentation of retina were manually set & measured using the scanner’s in-built caliper tool at each phase. When the hyper-reflective layers were identified, the point of maximal brightness of each band was chosen to be the locations of the corresponding ELM and RPE bands. The central foveal point thickness was defined as the distance between the ILM and RPE at the foveal center whereas the ORL thickness was the distance between ELM and RPE at the foveal center. Patients with disruption of ELM or RPE segmentation on OCT scans were excluded.
Statistical analysis
Data analysis was performed using the statistical package for social sciences for Windows software (SPSS version 22.0, SPSS Inc., Chicago, USA). Linear regression and Pearson correlation analysis were performed to find out the correlation between pre procedure corrected distance visual acuity, central foveal point thickness, and PROS thickness.
Results:
The study included a total of 60 eyes that were found eligible for study were recruited. The mean age was 56.96 years (±10.012 years). 46 of the 60 patients were male (76.6 %), and remaining 14 were females (23.44%). The age groups were 51 to 60 in 25 cases and 21 cases were of more than 60 years. Macular edema due to DME was seen in 50 cases (83.34%) and then was CRVO in 3 (8.45%) , CRAO in 2 (3.3%) and BRVO in another 5 (8.45%) cases.
The mean central foveal point thickness of these 60 pre- procedure patients was 326.20 ?m (±113 ?m) and post procedure was 291.68 ?m (±91 ?m).
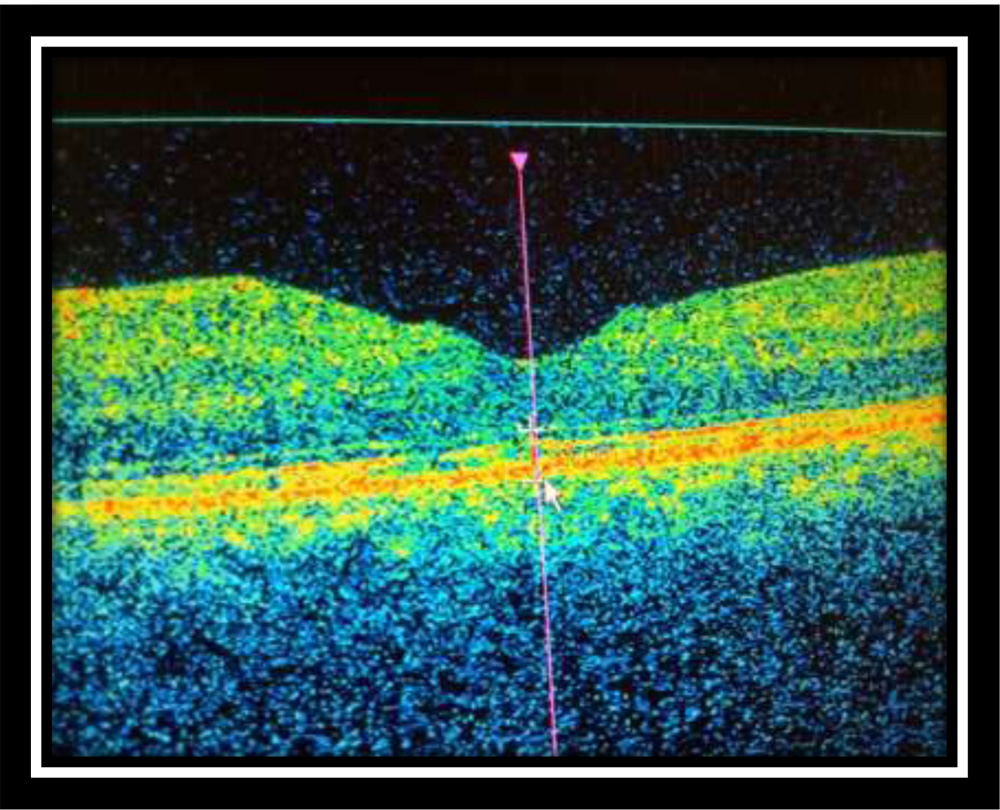
The mean pre-procedure outer retinal thickness (PROS) was 115.7 ?m (±35.6 ?m). Representative example of ILM, ELM, and RPE segmentation and measurement is shown in Figure 1 a,b,c.
Discussion:
With advancing technology in Ophthalmology especially Retina, OCT has become an objective and highly reliable method formacular edemaassessment. Besides measuring the actual macular thickening of the macula edema, newer generation OCT systems are capable of visualizing micro retinal structures. Studies carried outworldwide have reported contradicting results regarding the correlation between central retinal thickness and visual acuity in retinal vascular diseases10-13
Instead of using the total retinal thickness, Forooghian et al. measured the distance between photoreceptor inner segment/outer segment junction and RPE layer to approximate the length of photoreceptor outer segment (PROS) in patients with DME 3. Forooghian’s study showed that PROS length correlated better with patients’ vision than macular thickness measurement. However, the intersession repeatability of the PROS measurement with the self-developed OCT segmentation prototype software algorithm of Forooghian and his fellow colleagues was lower than the measurement of total macular retinal thickness with the Carl Zeiss OCT built-in software.3
In our study, we used Cirrus Zeiss HD-OCT to quantify the foveal PROS length of our patients. We reported a relatively low correlation of the PROS length with visual acuity (? < 0.346). The correlation between total retinal thickness at the foveal center and visual acuity in our patients with Macular edema was not as good as the PROS length. This demonstrates disagreement between the findings of our study and Forooghian’s study.
We compared the pre-procedure CDVA to post procedure CDVA and its significance statistically.
In our study 22 patients (37.8%) has CDVA of less than 6/36. But post procedure 42 eyes (70%) improved to CDVA of more than 6/18. 18(30%) has CDVA of 6/36 only. This was very significant statistically. P> 0.000
When compared with findings from other studies, we demonstrated that the PROS Length and vision are correlated than central retinal thickness and vision but this was statistically not significant.12-15
PROS length on OCT is 156.2 ? fovea for ME patients and the mean PROS length we obtained in this study is 145.1 ?m. The other series reported in the range of 35 to 130 which was lesser than what we have seen in our population.1-3, 7-10
There are a number of limitations in our study and the assessment of PROS length. Patients with minimal DME without OCT scans done might have been missed during clinical assessment and therefore might not have been recruited in our study. Moreover, the exclusion of patients with subretinal fluid or disruption of ELM or RPE may also lead to selection bias.
It was time consuming to identify the ELM and RPE bands since all the segmentation was identified manually. It was also important to note that the measurement performed in this study was at the central foveal point rather than the measurement of central subfield thickness in most other studies 4, 6, and 7; therefore our results of foveal thickness should not be directly compared to those from other studies 5, 15.
PROS length of the foveal center may reflect a patient’s visual potential at the point of fixation; however, activities of daily living such as reading rely highly on paracentral vision as well since it is necessary to locate the following word before one can move the point of fixation to the next word or next line with eye movement. PROS length measurement at foveal center does not adequately reflect this aspect of visual function.
Despite our results which were not significant statistically warranting a need to further increase the subjects in study. PROS length cannot explain all the variations in vision since other factors such as macular ischemia might play a role as well.
Actually, an association between PROS length and visual function in macular diseases has been reported 9, 10, and 13. But this was not the case in our study.
Post-operative BCVA showed a correlation with PROS length but not with central retinal thickness in eyes with macular edema. PROS length has also been shown to be significantly correlated with BCVA after the intervention.14
CONCLUSION:
We have concluded in this study that PROS length is important OCT parameter in the assessment of RVO patients and demonstrated that it is correlated with vision but was not significant statistically. Further studies should be conducted to investigate the potential of using ORL thickness as a long term visual prognostic factor in patients with RVO’S. The statistically visual acuity pre and post intervention was very significant.
References
- D. Nguyen,S.M.Shah,A.A.Khwajaetal.,“Two-year outcomes of the ranibizumab for edema of the macula in diabetes (READ-2) study,” Ophthalmology, vol. 117, no. 11, pp. 2146–2151, 2010.
- Diabetic Retinopathy Clinical Research Network, D. J. Browning, A. R. Glassman et al., “Relationship between optical coherence tomography-measured central retinal thickness and visual acuity in diabetic macular edema,” Ophthalmology,vol. 114, no. 3, pp. 525–536, 2007.
- Forooghian, P. F. Stetson, S. A. Meyer et al., “Relationship between photoreceptor outer segment length and visual acuity in diabetic macular edema,” Retina, vol.30, no.1, pp.63–70, 2010.
- J.Srinivasan,B.K.Monson,M.Wojtkowskietal.,“Characterization of outer retinal morphology with high-speed, ultrahigh- resolution optical coherence tomography,” Investigative Oph-thalmologyandVisualScience,vol.49,no.4,pp.1571–1579,2008.
- Chan,J.S.Duker,H.Ishikawa,T.H.Ko,J.S.Schuman,andJ. G. Fujimoto, “Quantification of photoreceptor layer thickness in normal eyes using optical coherence tomography,” Retina,vol. 26,no.6,pp.655–660,2006.
- Shahidi, Z. Wang, and R. Zelkha, “Quantitative thickness measurement of retinal layers imaged by optical coherence tomography,” American Journal of Ophthalmology,vol.139,no. 6, pp. 1056–1061, 2005.
- Aizawa, Y. Mitamura, T. Baba, A. Hagiwara, K. Ogata, and S. Yamamoto, “Correlation between visual function and photoreceptor inner/outer segment junction in patients with retinitis pigmentosa,” Eye,vol.23,no.2,pp.304–308,2009.
- Baba,S.Yamamoto,M.Araietal.,“Correlationofvisual recovery and presence of photoreceptor inner/outer segment junction in optical coherence images after successful macular hole repair,” Retina,vol.28,no.3,pp.453–458,2008.
- Ozdemir, M. Karacorlu, and S. A. Karacorlu, “Regression of serous macular detachment after intravitreal triamcinolone acetonide in patients with diabetic macular edema,” The American Journal of Ophthalmology,vol.140,no.2,pp.251.e1–251.e6,2005.
- Catier, R. Tadayoni, M. Paques et al., “Characterization of macular edema from various etiologies by optical coherence tomography,” American Journal of Ophthalmology,vol.140,no.2, pp. 200.e1–200.e9, 2005.
- Bandello,A.Polito,M.del Borrello,N.Zemella,and M.Isola,“‘Light’ versus ‘classic’ laser treatment for clinically significant diabetic macular oedema,” British Journal of Ophthalmology, vol. 89, no. 7, pp. 864–870, 2005.
- L. Laursen, F. Moeller, B. Sander, and A. K. Sjoelie, “Sub-threshold micropulse diode laser treatment in diabetic macular oedema,” British Journal of Ophthalmology, vol. 88, no. 9, pp. 1173–1179, 2004.
- Massin, G. Duguid, A. Erginay, B. Haouchine, and A. Gaudric,“Optical coherence tomography for evaluating diabetic macular edema before and after vitrectomy,” American Journal of Ophthalmology ,vol.135,no.2,pp.169–177,2003.
- Maheshwary AS, Oster SF, Yuson RM, et al. The association betweenpercent disruption of the photoreceptor inner segmentouter segment junctionand visual acuity in diabetic macular edema. Am J Ophthalmol 2010;150:637 e1.
- Saxena S, Srivastav K, Cheung CM, et al. Photoreceptor inner segment ellipsoid band integrity on spectral domain optical coherence tomography. Clin Ophthalmol 2014;8:250722.
Tables and figures for the study:-
|
|
AGE
(Yrs) |
CMT Pre Procedure(Microns) | PROS Pre Procedure
(Microns) |
CMT Post Procedure
(Microns) |
PROS Post
Procedure (Microns) |
|
| 60 | 60 | 60 | 60 | 60 | ||
| Mean | 56.967 | 326.400 | 156.250 | 291.683 | 145.100 | |
| Median | 57.500 | 301.000 | 126.000 | 263.500 | 129.500 | |
| Std. Deviation | 10.0118 | 113.8702 | 87.9697 | 91.5326 | 70.7746 | |
| Range | 51.0 | 539.0 | 469.0 | 391.0 | 334.0 | |
| Minimum | 24.0 | 105.0 | 30.0 | 158.0 | 59.0 | |
| Maximum | 75.0 | 644.0 | 499.0 | 549.0 | 393.0 | |
TABLE: 1. STATISTICAL PARAMETERS OF
VARIOUS VARIABLES IN THE STUDY
| TABLE: 2. GENDER AND AGE GROUP IN THE STUDY | ||||
| AGE GROUP(YRS) | GENDER | Total | ||
| FEMALE | MALE | |||
| 21 TO 30 | 0 | 1 | 1 | |
| 31 TO 40 | 1 | 1 | 2 | |
| 41 TO 50 | 2 | 9 | 11 | |
| 51 TO 60 | 6 | 19 | 25 | |
| >60 | 5 | 16 | 21 | |
| Total | 14 | 46 | 60 | |
TABLE:3. VARIOUS RETINAL VASCULAR DISEASES IN THE STUDY ( FREQUENCY)
| DISEASES | Frequency | Percent | |
| BRVO | 5 | 8.3 | |
| CRAO | 2 | 3.3 | |
| CRVO | 3 | 5.0 | |
| DME | 50 | 83.3 | |
| Total | 60 | 100.0 | |
| TAB LE 4. PRE PROCEDURE CDVA VS. POST PROCEDURE CDVA (Cross-tabulation) | |||||||
| CDVA POST PROCEDURE | CDVA PRE PROCEDURE | ||||||
| <1/60 | 1/60 TO 3/60 | 6/60 TO 6/36 | 6/24 TO 6/18 | 6/12 TO 6/9 | |||
| <1/60 | 1 | 1 | 0 | 0 | 0 | ||
| 1/60 TO 3/60 | 1 | 6 | 0 | 0 | 0 | ||
| 6/60 TO 6/36 | 0 | 1 | 8 | 0 | 0 | ||
| 6/24 TO 6/18 | 0 | 0 | 4 | 19 | 0 | ||
| 6/12 TO 6/9 | 0 | 0 | 0 | 4 | 12 | ||
| 6/6 TO 6/5 | 0 | 0 | 0 | 1 | 0 | ||
| Total | 2 | 8 | 12 | 24 | 12 | ||
P <0.000
TABLE: 5. POST INTRAVITREAL COREECTED DISTANCE VISUAL ACUITY
| CDVA POST PROCEDURE | Frequency | Percent | |
| <1/60 | 2 | 3.3 | |
| 1/60 TO 3/60 | 7 | 11.7 | |
| 6/60 TO 6/36 | 9 | 15.0 | |
| 6/24 TO 6/18 | 23 | 38.3 | |
| 6/12 TO 6/9 | 16 | 26.7 | |
| 6/6 TO 6/5 | 3 | 5.0 | |
| Total | 60 | 100.0 | |
TABLE: 6. POST INTRAVITREAL COREECTED DISTANCE VISUAL ACUITY
| CDVA PREPROCEDURE | Frequency | Percent |
| <1/60 | 2 | 3.3 |
| 1/60 TO 3/60 | 8 | 13.3 |
| 6/60 TO 6/36 | 12 | 20.0 |
| 6/24 TO 6/18 | 24 | 40.0 |
| 6/12 TO 6/9 | 12 | 20.0 |
| 6/6 TO 6/5 | 2 | 3.3 |
| Total | 60 | 100.0 |