Dr. Mihir Mehta, Dr. Mehul Ashvin Kumar Shah, Dr. Narayan S Alane, Dr. Pooja Kalbande
ABSTRACT
Aim:
To study relationship of visual acuity of Patients of Retinitis pigmentosa with central macular thickness (CMT), RNFL and IS thickness.
Method:
We retrospectively reviewed the database in a standard pretested format of consecutive series of 430 eyes with RP who underwent comprehensive clinical examination with measurement of thicknesses ORL, IS Junction, CMT, RNFL by HD -OCT & data analysed by SPSS 22.
Results:
Of all 429 patients BCVA was < 6/ 60 in 70.9% of patients. We studied BCVA and observed that it was related to CMT thickness (P<0.000). The BCVA was NOT statistically related to Outer Retinal Layer (P<0.248) and inner segment thickness , but significantly related to average RNFL thickness P<0.000
Conclusions:
BCVA is significantly related to CMT and Average RNFL thickness,but not to ORL thickness and inner segment in our study in patients with RP.
KEYWKORDS : RETINA , PHOTORECEPTOR, MACULA ,.
INTRODUCTION
Retinitis pigmentosa (RP) is a group of hereditary disorders of the photoreceptors and retinal pigment epithelium (RPE) which gradually causes night blindness and progressive constriction of the visual field. Waxy optic disc pallor, arteriolar narrowing and hyalinization are found in almost all cases. Pigmentary changes are usually seen but may be absent or mild, invariably early in the course of the disease. The pigmentary changes seen are characteristic of bone spicules, diffuse granularity or stippling and pigment clumping; these are due to photoreceptors’ degeneration, atrophy in the outer retina and pigment epithelium, and RPE cells migrating into the retina,[1] 1 in 4,000 is the conservative prevalence estimate of RP worldwide. It is seen that prevalence increases during the first four decades of life and does not progress over the following decades. Mostly up to 25% of patients with RP become legally blind in both eyes, rarely they los total vision. The pattern of inheritance in RP are autosomal dominant, autosomal recessive, X-linked recessive or isolated
The photoreceptor and RPE function loss in RP progresses posteriorly and can lead to loss of visual acuity from involvement of the macula and constriction of the field of vision. Macular degeneration is the most common cause of visual loss in macular disease which affects RP. Patients who have a long duration are those who have widespread peripheral degenerative changes, have macular atrophy of the RPE and mottled angiographic transmission defect.
Many researchers have made efforts to find out the relationship between OCT structural findings and visual function in inherited retinal disease. Both retinal thinning caused by photoreceptor cell loss and retinal thickening due to macular edema appeared to be associated with reduced visual acuity in typical RP patients. The advent of spectral-domain (SD) OCT enabled the observation of microstructural changes within individual retinal layers, including the IS and the OS of the photoreceptor and retinal nerve fiber layers(RNFL). The present study investigated the correlation between SD-OCT, especially with respect to photoreceptor integrity status, and best-corrected visual acuity (BCVA) in RP patients with CMT and RNFL thickness.
METHOD :
A total of 430 patients were studied retrospectively at our institute between the time period of june ’14 to june’16, of which 418 patients were diagnosed with typical RP and rest were diagnosed with atypical RP. Informed cnsent was taken from all patients.The visual acuity was measured using snellen’s visual acuity chart.
RP was diagnosed on the basis of a history of night blindness and ophthalmologic findings. To diagnose RP, each participant was subjected to a complete ophthalmologic examination, including a review of the participant’s medical and clinical history, measurement of BCVA, slit-lamp biomicroscopy, dilated fundoscopic . No patient had a history of ocular or systemic disease that could have resulted in significant retinal pigmentary changes. Eyes with concomitant ocular diseases other than cataracts, that is, with preexisting macular disease, glaucoma, or diabetic retinopathy, and eyes showing poor fixation because of extremely low visual acuity (less than hand movement) were excluded.
All patients were imaged via spectral-domain OCT (SD-OCT) using a Cirrus HD-OCT (Carl Zeiss Meditec). Our Cirrus HD-OCT platform is calibrated on a regular basis by a technician employed by the manufacturer. Pupil dilatation was performed if necessary. All accepted images exhibited a centered fixation point, were well focused, with even and adequate illumination, and had a signal strength ≥ 7. Grayscale images were employed to permit precise identification of retinal layers and the conduct of thickness measurements thereon. Three-dimensional macular cube OCT data were obtained using the Macular Cube 512 × 128 scan mode and 5-line raster mode.The status of the foveal IS/OS junction was examined in SD-OCT images via evaluation of junctional status over a region 1.5 mm in width encompassing the fovea and ouer retinal layer and inner segment thickness were measured manually as shown in FIGURE 1. Average and four quadrants peripapillary RNFL thickness values were scanned.
The data was analysed using SPSS version 22.0. with the help pf chi square test AND p value less than 0.05 was taken as statistically significant.
RESULTS :
A total of 430 consecutive RP patients were examined. The mean ± SD patient age was 47.5 ± 18.1 years (range 5-90 years), of which 155 (36%) were females and 275 (64%)males.
– Of all 429 patients BCVA was < 6/ 60 in 70.9% of patients.
-FIGURE 2 is showing visual acuity in study patients.
-CENTRAL MACULAR THICKNESS was measured in 168 (39%) of patients as it was not possible to measure in rest of the patients due to poor fixation.
-RETINAL NERVE FIBRE LAYER THICKNESS was measured in 172(40%) patients .103 patients (24%) were having RNFL THICKNESS in the range of 51-100 micrometer.
-INNER SEGMENT THICKNESS was measured in 172 (40%) patients and around 150 (34.9%) patients were having 51-100 micrometer thickness.
– TABLE 1 IS SHOWING RELATIONSHIP OF VISUAL ACUITY WITH CENTRAL MACULAR THICKNESS .
– BCVA is related to the central macular thickness (CMT) with p value 0. 000 . Visual acuity was relatively better with CMT between 150-250.
–TABLE 2 IS SHOWING CORRELATION OF VISUAL CUITY WITH RETINAL NERVE FIBRE LAYER THICKNESS
-Average RNFL thickness was measured in 172 patients. It was observed that BCVA is related to Average RNFL thickness( p‹<0. 000).
-TABLE 3 IS SHOWING CORRELATION OF VISUA ACUITY WITH OUTER RETINAL LAYER THICKNESS
– ORL thickness was measured in 172 patients and it was observed that BCVA was not related to ORL thickness(p=‹0. 248).
-TABLE 4 IS SHOWING CORRELATION OF VISUAL ACUITY WITH INNER SEGMENT THICKNESS
– INNER SEGMENT THICKNESS was measured in 172 patients and it was not found to be statistically significant to visual acuity.
DISCUSSION :
-A total of 430 consecutive RP patients were examined. The mean ± SD patient age was 47.5 ± 18.1 years (range 5-90 years), of which 155 were females and 275 males.
– Of all 430 patients BCVA was < 6/ 60 in 70.9% of patients.
– In our study Central macular thickness was measured in 168 patients and could not be measured in rest of the patients due to poor visual acuity. BCVA is related to the central macular thickness (CMT) with p value ‹0. 000 . Visual acuity was relatively better with CMT between 150-250. Acuity was maximal for intermediate retinal thickness and appeared to decline for both lesser and greater retinal thicknesses.The marked decline in visual acuity for small retinal thicknesses reflects cell loss. OCT measurements of retinal thickness would complement visual acuity measurements by being an objective assessment of retinal architecture spanning the fovea.
– Average RNFL thickness was measured in 172 patients in the current study using SD-OCT.
Thinning of the RNFL was most commonly observed in the inferior quadrant followed by the nasal quadrant, thickenning commonly seen in the temporal quadrant followed by an approximately equal number of superior and inferior quadrants. In our current cohort of RP patients, there was no apparent trend between the RNFL thickness and the ophthalmoscopic appearance of optic nerve pallor.In one study, thinning was found in 40% of the RP patients when a TD-OCT was used to assess the peripapillary RNFL and thickening was found in another 40% of the patients studied (thickening was found mostly in the temporal quadrant in that study).
– Outer retinal layer thickness is measured from outer border of RPE to ellipsoid zone of the photoreceptors. Here change in its thickness was not significantly associated with visual acuity.
– Inner segment thickness is measured from ellipsoid zone of photoreceptors to the ELM , that is external limiting membrane and in our study it was also not found to be significantly related to the visual acuity. But as the visual acuity deteriorates , the thickness of IS also decreases. Most patients had IS thickness in the range of 51-100 micrometer.
CONCLUSION :
–In our study best corrected visual acuity was found to be significantly related to the cental macular thickness and retinal nerve fiber layer thickness, but it was not found to be related to the outer retinal layer and inner segment thicknesses.
REFERENCES :
- HorioN, KachiS, HoriK, et al. Progressive change of optical coherence tomography scans in retinal degeneration slow mice.Arch Ophthalmol. 2001;119:1329–1332. [CrossRef] [PubMed]
- LiQ, TimmersAM, HunterK, et al. Noninvasive imaging by optical coherence tomography to monitor retinal degeneration in the mouse. Invest Ophthalmol Vis Sci.2001;42:2981–2989. [PubMed]
- Huang D, Swanson EA, Lin CP, et al. Optical coherence tomography. Science 1991;254(5035):1178-81.
- Fujimoto JG, Bouma B, Tearney GJ, et al. New technology for high-speed and high-resolution optical coherence tomography. Ann NY Acad Sci 1998;838:95-107.
- Saxena S, Srivastav K, Cheung CM, et al. Photoreceptor inner segment ellipsoid band integrity on spectral domain optical coherence tomography. Clin Ophthalmol 2014;8:2507-22.
- Hagiwara A, Mitamura Y, Kumagai K, et al. Photoreceptor impairment on optical coherence tomographic images in patients with retinitis pigmentosa. Br J Ophthalmol 2013;97(2):237-8.
- Fundamentals of Biostatistics. 2000; 5th ed.Duxbury Press Boston, MA.
- Sandberg MA, Brockhurst RJ, Gaudio AR, Berson EL. The association between visual acuity and central retinal thickness in retinitis pigmentosa. Invest Ophthalmol Vis Sci 2005;46:3349–3354 [PubMed]
- Aizawa S, Mitamura Y, Baba T, Hagiwara A, Ogata K, Yamamoto S. Correlation between visual function and photoreceptor inner/outer segment junction in patients with retinitis pigmentosa. Eye (Lond) 2009;23:304308 [PubMed]
- Hood DC, Lin CE, Lazow MA, Locke KG, Zhang X, Birch DG. Thickness of receptor and post-receptor retinal layers in patients with retinitis pigmentosa measured with frequency-domain optical coherence tomography. Invest Ophthalmol Vis Sci 2009;50:23282336 [PMC free article] [PubMed]
FIGURE 1: MEASUREMENT OF INNER SEGMENT THICKNESS (RED LINE)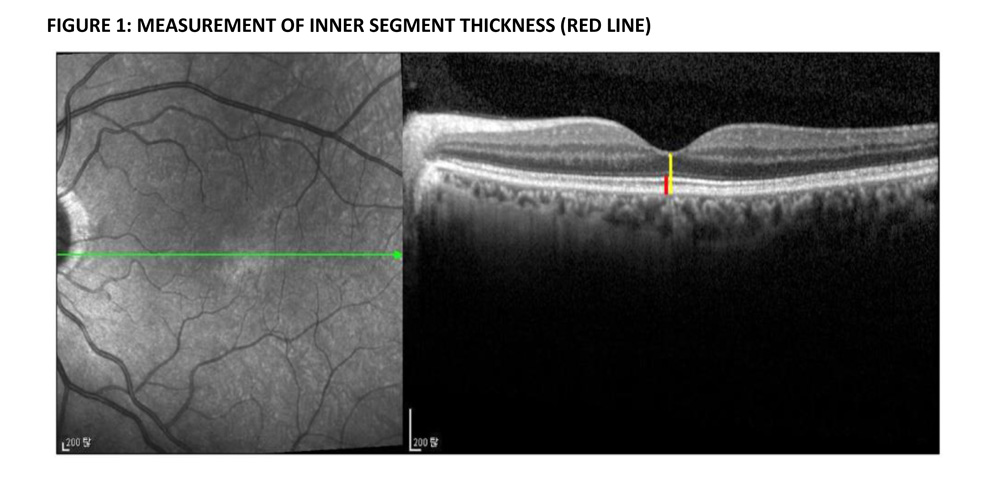
FIGURE 2 : VISUAL ACUITY IN STUDY PATIENTS
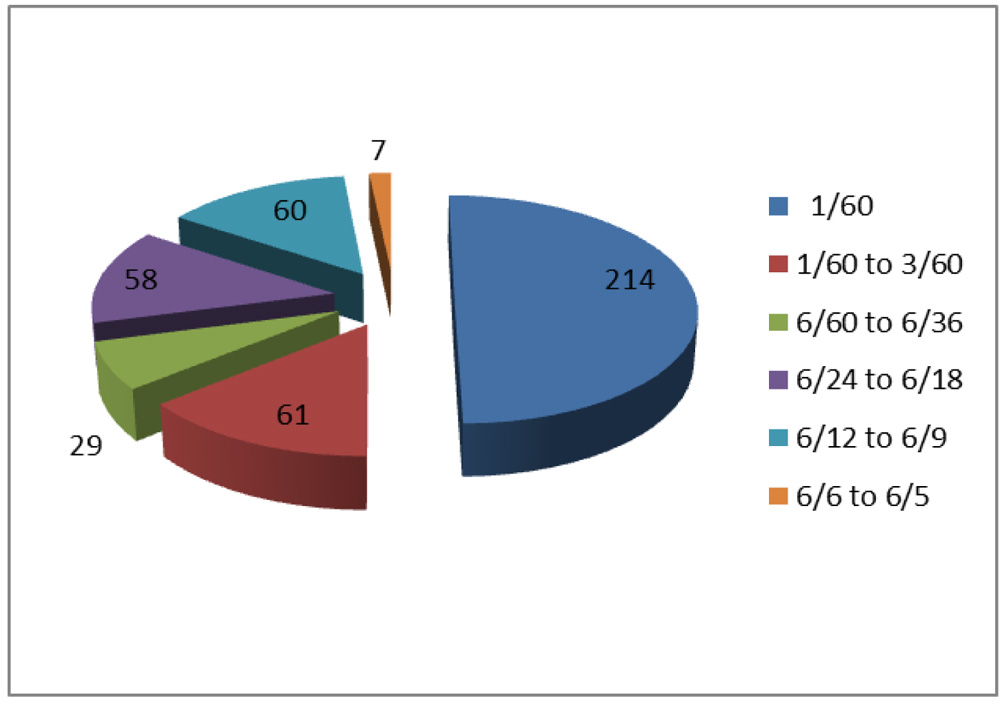 TABLE 1 : CORRELATION OF VISUAL ACUITY WITH CENTRAL MACULAR THICKNESS
| VISUAL ACUITY | CENTRAL MACULAR THICKNESS (IN MICROMETER) | ||||||
| 51-100 | 101-150 | 151-200 | 201-250 | 251-300 | 301-350 | TOTAL | |
| < 1/60 | 2 | 24 | 55 | 19 | 8 | 0 | 108 |
| 1/60 TO 3/60 | 1 | 10 | 5 | 1 | 4 | 0 | 21 |
| 6/60 TO 6/36 | 1 | 0 | 2 | 2 | 1 | 0 | 6 |
| 6/24 TO 6/18 | 0 | 2 | 10 | 5 | 0 | 0 | 17 |
| 6/12 TO 6/9 | 1 | 0 | 3 | 5 | 2 | 2 | 13 |
| 6/6 TO 6/5 | 0 | 0 | 0 | 2 | 0 | 0 | 2 |
| TOTAL | 5 | 36 | 75 | 34 | 15 | 2 | 167 |
P value ‹0. 000
TABLE 2 : CORRELATION OF VISUL ACUITY WITH RETINAL NERVE FIBRE LAYER THICKNESS
| VISUAL ACUITY | RETINAL NERVE FIBRE LAYER THICKNESS (IN MICROMETER) | |||||
| 1-50 | 51-100 | 101-150 | 151-200 | 201-250 | TOTAL | |
| < 1/60 | 11 | 64 | 32 | 2 | 2 | 111 |
| 1/60 TO 3/60 | 0 | 20 | 1 | 0 | 0 | 21 |
| 6/60 TO 6/36 | 0 | 1 | 5 | 0 | 0 | 6 |
| 6/24 TO 6/18 | 0 | 11 | 7 | 0 | 0 | 18 |
| 6/12 TO 6/9 | 0 | 7 | 6 | 0 | 0 | 13 |
| 6/6 TO 6/5 | 0 | 0 | 1 | 1 | 0 | 2 |
| TOTAL | 11 | 103 | 52 | 3 | 2 | 171 |
P value ‹ 0. 000
TABLE 3 : CORRELATION OF OUTER RETINAL LAYER THICKNESS AND VISUAL ACUITY
| VISUAL ACUITY | OUTER RETINAL LAYER THICKNESS | |||||
| 1-50 | 51-100 | 101-150 | 151-200 | 201-250 | 251-300 | |
| < 1/60 | 7 | 37 | 47 | 17 | 2 | 1 |
| 1/60 TO 3/60 | 2 | 11 | 4 | 4 | 0 | 0 |
| 6/60 TO 6/36 | 1 | 1 | 2 | 2 | 0 | 0 |
| 6/24 TO 6/18 | 1 | 4 | 10 | 3 | 0 | 0 |
| 6/12 TO 6/9 | 1 | 0 | 6 | 4 | 2 | 0 |
| 6/6 TO 6/5 | 0 | 0 | 2 | 0 | 0 | 0 |
| TOTAL | 12 | 53 | 71 | 30 | 4 | 1 |
P value 0. 248
TABLE 4 : CORRELATION OF VISUAL ACUITY WITH INNER SEGMENT THICKNESS ( p value 0. 307
| VISUAL ACUITY | INNER SEGMENT THICKNESS( IN MICROMETER) | |||||
| 1-50 | 51-100 | 101-150 | 151-200 | 201-250 | TOTAL | |
| < 1/60 | 4 | 97 | 8 | 2 | 2 | 113 |
| 1/60 TO 3/60 | 0 | 22 | 1 | 0 | 0 | 23 |
| 6/60 TO 6/36 | 0 | 7 | O | 0 | 0 | 7 |
| 6/24 TO 6/18 | 1 | 12 | 1 | 1 | 0 | 15 |
| 6/12 TO 6/9 | 0 | 10 | 1 | 0 | 0 | 11 |
| 6/6 TO 6/5 | 0 | 2 | 1 | 0 | 0 | 3 |
| TOTAL | 5 | 150 | 12 | 3 | 2 | 172 |