Dr.Anubhav Goyal, G12318, Dr. Giridhar Anantharaman, Dr. Mahesh G
AIM:-
To compare reflectivity and thickness spectral domain optical coherence tomography (SD-OCT) in idiopathic epiretinal membrane (ERM), before and after ERM surgery.
METHODS:-
A retrospective study analyzing SD-OCT patterns of ERM and reflectivity of inner retinal layers (IRL), outer nuclear layer (ONL), photoreceptor complex (PRC) and central macular thickness (CMT) in eyes undergone ERM peeling surgery from 2012 to 2015 and normal control eyes. Secondarily, relationship between SD-OCT and best corrected visual acuity (BCVA) were also studied.
RESULTS:-
64 eyes of 64 patients with idiopathic ERM with mean postoperative followup up of 12 weeks and 12 normal eyes were evaluated. ERM showed 2 patterns on SD-OCT- (1)uniform adherent, (2) with cleavage. ERM with uniform adhesion had thicker CRT, higher IRL reflectivity, thinner ONL and thinner PRC as compared to ERM with cleavage. Postoperatively, uniform adherent ERM showed significant decrease in CRT (607.22 to 420.80m)(p<0.001), decrease in IRL reflectivity (410.95 to 199.40m)(p<0..1), increase in ONL (76.45 to 114.75m)(p<0.001)and increase in PRC (65.87 to 69.03m)(p<0.001). While, ERM with cleavage preoperatively showed comparatively thinner CRT, lesser IRL reflectivity, thicker ONL and PRC with postoperative significant decrease in CRT (566.21 to 417.33m)(p<0.001)and IRL reflectivity ( 358.79 to 198.83m)(p<0.001)while increase in ONL (102.04 to 127.67m) and PRC (73.83 to 75.50m)(p<0.001). The changes in values of reflectivity were less in ERM with cleavage as compared to uniform adherent ERM. The larger improvement in BCVA was correlated with higher inner reflectivity of uniform adherent ERM (0.70 to 0.31 logMAR)(p<0.001) whereas improved final BCVA was seen in ERM with cleavage ( 0.52 to 0.20logMAR)(p<0.001). BCVA improvement had strong correlation with decrease in CRT (0.23) and INLH (0.24) whereas it had weak correlation with increase in ONL (0.14) and no correlation with PRC change. Change in postoperative reflectivity was still higher than normal eyes. Persistent subfoveal ISOS loss was associated with poor visual outcomes in 21/64 (32.81%) eyes.
CONCLUSION:-
Qualitative pattern of ERM adhesion, quantitative difference in reflectivity and thickness between preoperative, postoperative and normal SD-OCTs allow assessment of retinal changes and improvement in BCVA secondary to ERM surgery.
Abbreviations :– SD-OCT- Spectral domain optical coherence tomography, IERM- idiopathic epiretinal membrane, CRT- central retinal thickness, IRL- inner retinal layers reflectivity, ONL- outer nuclear layer reflectivity, PRC- photoreceptor complex, BCVA- best corrected visual acuity, ILM- internal limiting membrane, PVD– posterior vitreous detachment, IS-OS- inner segment outer segment junction.
Idiopathic epiretinal membrane (IERM) also known as macular pucker or cellophane maculopathy, is a pathologic avascular fibrocellular vitreomacular interface disorder with an unknown etiology, usually caused after complete PVD induction. Clinical presentation of IERM can range from completely asymptomatic, diagnosed on routine examination to profound symptoms like metamorphopsia, photopsia, decreased visual acuity and central vision defect, which can impair quality of life. Most ERMs occur after 50 years of age with prevalence ranging from 2.2% to 28.9% depending on population based studies.1,2,3 Various number of cells , like retinal pigment epithelium cells, glial cells and fibroblasts are involved in pathogenesis of ERM.4
Spectral-domain optical coherence tomography (SD-OCT) acts as a useful non-invasive tool for diagnosis and monitoring vitreo-macular disorders, like ERM induced traction and changes in retina subsequent to ERM peeling vitreous surgery.3,5,6,7 There are lots of previous SD-OCT studies on ERM focussing on morphology of outer retinal layers like external limiting membrane (ELM), inner segment- outer segment (IS-OS) line, ellipsoid line or changes in thickness of retinal layers.5-7,11-15 Kurian et al3 studied retinal layer from inner limiting membrane (ILM) to retinal pigment epithelium (RPE). Surgical ERM removal relieves traction from macula and usually alleviate the symptoms.8,9,10
Since there are very few studies documenting the effect of ERM removal surgery, especially on all the retinal layers from ILM to RPE. The purpose of this study was to compare SD-OCT findings in different layers, not only in outer retina but in whole retinal layers from ILM to RPE, retinal thickness and change in best corrected visual acuity (BCVA) before and after ERM removal surgery. Additionally, the relationship of SD-OCT features and BCVA was also assessed.
MATERIALS AND METHODS
64 eyes of 64 patients with idiopathic ERM who underwent ERM removal surgery between 2012 to 2015 (4 years) were studied retrospectively. The minimum followup period was 12 weeks post-operatively. Patients with eye diseases influencing the visual acuity, such as glaucoma, macular degeneration, diabetic retinopathy, rhegmatogenous retinal detachment, or any other retinal pathology were excluded from the study.
Detailed clinical examination with best corrected visual acuity (BCVA) using Snellen charts and SD-OCT was done at initial baseline visit pre-operatively and on followup visit at 6 weeks and 12 weeks post-operatively. Depending on OCT-based idiopathic ERM classification system proposed by Stevenson et al2 we had included symptomatic eyes showing Type 1C involving fovea in all the cases.
| OCT based morphologic classification of idiopathic ERMs2 | |
| Type 1: Fovea-involving ERM | |
| 1A
1B 1C |
Outer retinal thickening and minimal inner retinal change
Outer retinal inward projection and inner retinal thickening Prominent thickening of the inner retinal layers |
| Type 2: Fovea sparing ERM | |
| 2A
2B |
Formation of a macular pseudohole
Schisis-like intraretinal splitting |
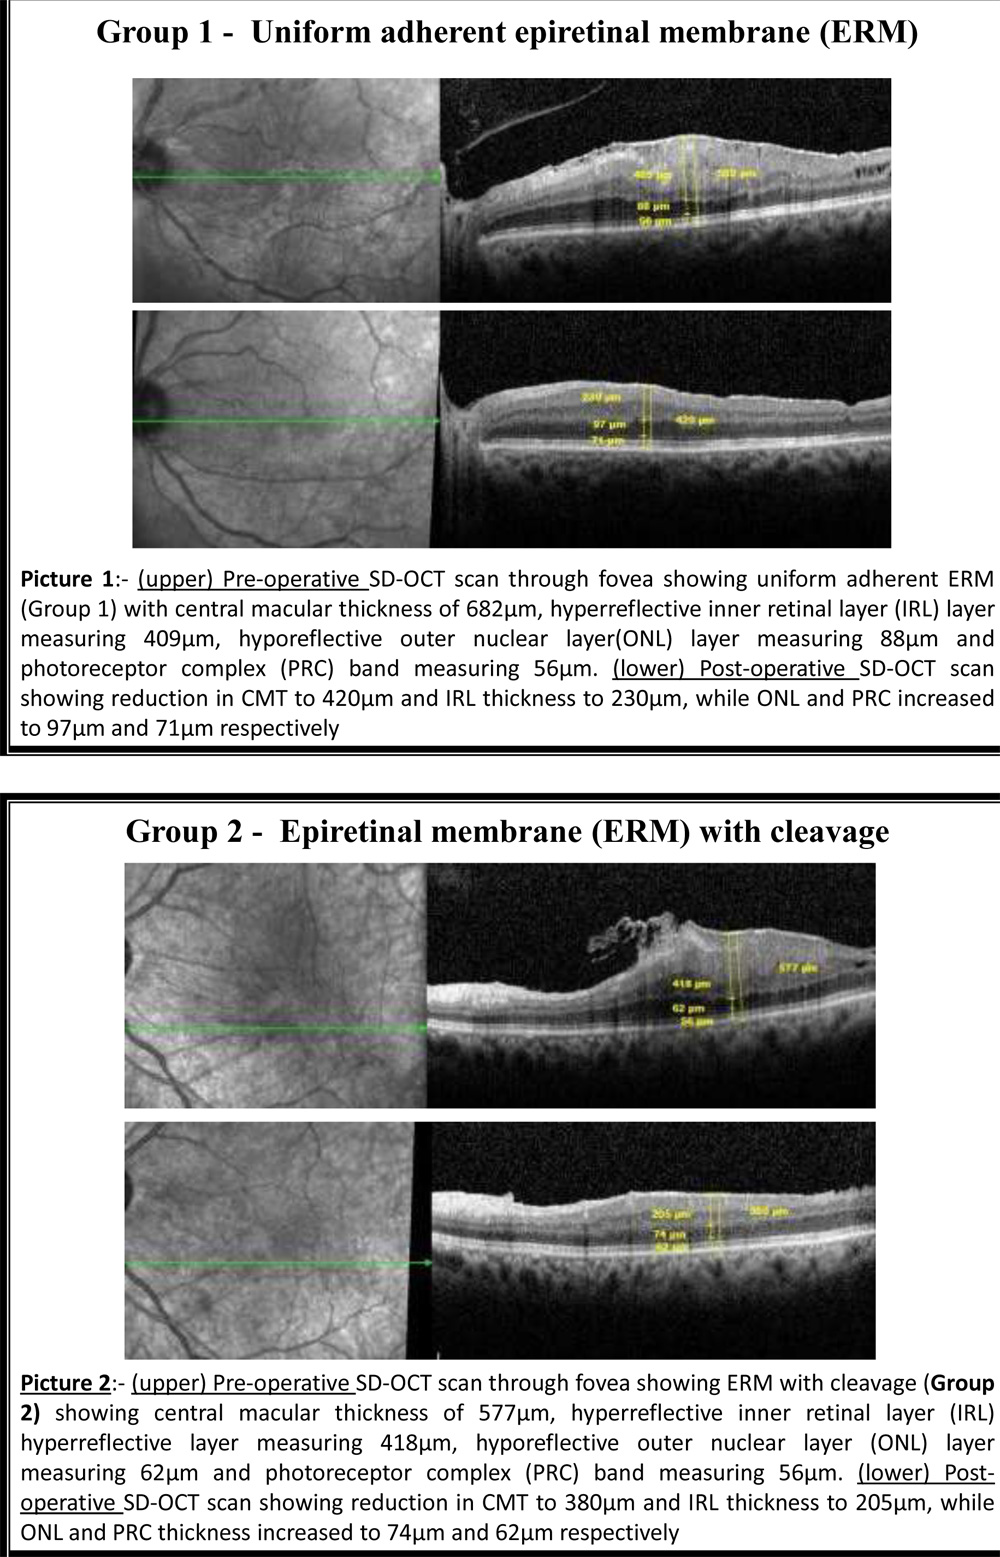
Additionally we had divided eyes under 2 groups according to the pattern of adhesion of ERM in macula:- Group 1- Uniform adherent ERM and Group 2- ERM with cleavage.
All patients underwent 23/25 G pars plana vitrectomy surgery with ERM peeling along with Internal limiting membrane (ILM) peeling in all the cases. Trypan Blue G (0.06% w/v) dye was used to stain ERM and Brilliant Blue dye (0.05% w/v) was used separately to stain ILM. Patients who underwent cataract extraction between the preoperative and postoperative SD-OCT were excluded. The best-corrected visual acuity (BCVA) and Spectral domain optical coherence tomography (SD-OCT) findings (Heidelberg Engineering, Heidelberg, Germany) were investigated pre-operatively and at 6 and 12 weeks post-operatively. Normal CFT is <320 μm and thickened CFT is >320 μm2. SD-OCT analysis was done from ILM to outer border of RPE and at all the visits reflectivity of inner retinal layers (IRL), outer nuclear layer (ONL), photoreceptor complex (PRC) and central macular thickness (CMT)was assessed in all the eyes undergone ERM peeling surgery. All the measurements were done by the built-in scale of the SD-OCT system. Measurements of central macular thickness were obtained directly from the OCTs by using manually placed computer software controlled cursors on various retinal boundaries. These boundaries were located based on the difference in reflectivity between the vitreous (minimally reflective) and retina (moderately reflective), and the difference in reflectivity between the photoreceptor layer (minimally reflective) and retinal pigment epithelium (highly reflective)12. Inner retinal layers (IRL) denotes hyper-reflective band and measures from inner layer of ERM to inner border of next hypo-reflective band on outer nuclear layer, outer nuclear layer (ONL) denotes next hypo-reflective band measuring from outer border of hyper-reflective IRL to external limiting membrane line, photoreceptor layer (PRC) measured from external limiting membrane line to inner border of retinal pigment epithelium (RPE) and central macular thickness was measured from ERM to outer border of RPE. All measurements were done in thickest part of traction due to ERM adhesion on retina, involving the fovea. Best retinal restoration was achieved when outer and inner retinal layers showed similar reflectivity within every retinal layer compared to pre-operative SD-OCT pictures.
Snellens Visual Acuity was converted to logarithm of minimal angle of resolution (logMAR) equivalents. At all the visits SD-OCT images were studied by a single examiner and measurements of 12 weeks postoperative period were noted in this study. Statistical Package for the Social Sciences software version 17.0 (SPSS Inc.,Chicago, Illinois, USA) was used and values less than 0.05 were considered statistically significant. (** indicates a significant association (p-value <0.05)).
RESULTS
64 eyes of 64 patients with idiopathic ERM with mean postoperative followup up of 12 weeks were evaluated retrospectively. Mean age of patients was 64.34 years and there were 39 females out of 64 patients. Depending on patterns shown on SD-OCT patients were divided into 2 groups – Group 1 (uniform adherent ERM) (39 eyes) and group 2 (ERM with cleavage) (25 eyes). Other baseline characteristics and mean baseline pre-operative BCVA and SD-OCT parameters for both group 1 and 2 are shown in Table 1. Pre-operatively, Group 1 (uniform adherent ERM) had thicker CRT, thicker hyper-reflective IRL, thinner hypo-reflective ONL and thinner PRC as compared to Group 2 (ERM with cleavage). Postoperatively, Group 1 (uniform adherent ERM) showed significant decrease in mean CRT (607.22 to 420.80µm)(p<0.001) and mean IRL thickness (410.95 to 199.40µm)(p<0.001), while increase in mean ONL thickness (76.45 to 114.75µm)(p<0.001) and mean PRC thickness (65.87 to 69.03µm)(p<0.001). Group 2 (ERM with cleavage) showed significant decrease in mean CMT (566.21 to 417.33µm)(p<0.001) and mean IRL (358.79 to 198.83µm)(p<0.001) while increase in mean ONL (105.41 to 128.70µm)(p<0.001) and mean PRC (73.83 to 75.50µm)(p<0.001) (Table 2, Figure 2). Post-operatively, SD-OCT thickness for CRT and hyper-reflective IRL reduced by mean of 186.42µm and 211.55µm respectively in group 1 versus 148.88µm and 159.96µm respectively in group 2, while, hypo-reflective ONL and iso-reflective PRC thickness increased by mean of 38.3µm and 3.16µm respectively in Group 1 versus 23.29µm and 1.67µm respectively in Group 2. Change in SD-OCT thickness values were less in ERM with cleavage as compared to uniform adherent ERM (Table 3). 12 weeks post-operative SD-OCT showed persisting macular evagination in all the eyes, even when all retinal layers got restored within each retinal layer.
At 12 weeks follow-up visit, best corrected visual acuity (BCVA) improved from 0.70 (±0.35) LogMAR pre-operatively to 0.32 (±0.31) LogMAR post-operatively in Group 1 while, it improved from 0.52 (±0.18) LogMAR pre-operatively to 0.29 (±0.20) LogMAR post-operatively in Group 2 (Table 4)(Figure 2). BCVA improvement was higher in Group 1 as compared to Group 2 at 12 weeks follow-up visit. BCVA improvement had significantly strong correlation with decrease in CRT (0.23)(p-0.23) and IRL (0.24)(p-0.24) whereas it has statistically non-significant weak, negative correlation with increase in ONL (-0.16)(p-0.19) and PRC (-0.09)(p-0.46)(Table 5).
Persistent subfoveal ISOS loss was seen in 21 (32.81%) eyes having pre-operatively existing IS-OS loss and was associated with poor visual outcomes in these eyes. BCVA improved from 0.857 logMAR to 0.633 loMAR in eyes with pre-existing ISOS loss, while it improved significantly from 0.530 logMAR to 0.160 logMAR (p<0.001) in eyes without pre-existing ISOS loss in both the groups (Table 6). None of the eyes with pre-operative IS/OS junction loss shown normal appearance of ISOS junction at any point of time post-operatively during the study.
| Table 1:- Demographic baseline characteristics data of patients with epiretinal membrane (ERM) | |
| Mean post-operative followup duration | 12.54 weeks |
| Number of eyes, n | 64 eyes (64 patients) |
| Mean age, years( ±SD) | 64.34 (±8.375) |
| Gender ratio(F/M) | 39 F/ 25 M |
| Duration of complains, n (range) | 12.70 (2-60) months |
| Pre-operative best corrected visual acuity, LogMAR (±SD)
-Uniform adherent ERM -ERM with cleavage |
0.70 (±0.35) 0.52 (±0.18) |
| Optical coherence tomography parameters of uniform adherent ERM, µm (±SD)
Central retinal thickness (CRT) Inner retinal layer (IRL) Outer nuclear layer (ONL) Photoreceptor complex (PRC) |
607 (±93.17) 410.95 (±88.31) 76.45 (±37.5) 65.87 (±6.63) |
| Optical coherence tomography parameters of ERM with cleavage, µm (±SD)
Central retinal thickness (CRT) Inner retinal layers (IRL) Outer nuclear layer (ONL) Photoreceptor complex (PRC) |
566.21 (±109.98) 358.79 (±81.49) 105.41 (±28.54) 73.83 (±7.41) |
| Table 2:- Comparison between optical coherence tomography parameters for pre-operative patients with epiretinal membrane and post-operative without epiretinal membrane | ||||||
| Group 1- Uniform adherent epiretinal membrane | ||||||
| Pre-operative
Mean (±SD) |
Post-operative
Mean (±SD) |
P -value | Interpritation | |||
| Central Retinal Thicknes(µm)
Inner Retinal Layer (µm) Outer Nuclear Layer (µm) Photoreceptor Complex(µm) |
607.22 (±93.17)
410.95 (±88.31) 76.45 (±37.5) 65.87 (±6.63) |
420.80 (±80.80)
199.40 (±83.52) 114.75 (±30.57) 69.03 (±7.52) |
<0.001
<0.001 <0.001 <0.001 |
Preop>postop
Preop>postop Preop<postop Preop<postop |
||
| Group 2- Epiretinal Membrane with cleavage | ||||||
| Pre-operative
Mean (±SD) |
Post-operative
Mean (±SD) |
P -value | Interpritation | |||
| Central Retinal Thickness(µm)
Inner Retinal Layer (µm) Outer Nuclear Layer (µm) Photoreceptor Complex(µm) |
566.21(±109.98)
358.79(±81.49) 105.41(±28.54) 73.83(±7.41) |
417.33(±72.50)
198.83(±56.01) 128.70(±26.41) 75.50(±7.78) |
<0.001
<0.001 <0.001 <0.001 |
Preop>postop
Preop>postop Preop<postop Preop<postop |
||
Wilcoxon signed rank test
Figure 2: Bar Diagram comparing mean SD-OCT values of different retinal layers parametes in both the Groups before and after ERM removal surgery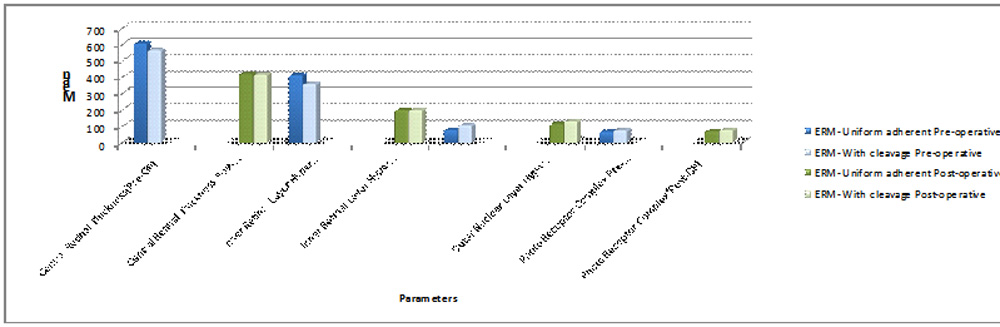
| Table 3:- Change from pre-operative to post-operative optical coherence tomography parameters | ||||
| Group 1- uniform adherent ERM | Group 2- ERM with cleavage | P-value | Interpretation | |
| Central retinal thickness, µm | -186.42 | -148.88 | 0.07 | Change in Group 1 > group 2 |
| Inner retinal layers, µm | -211.55 | -159.96 | 0.01** | Change in Group 1 > group 2 |
| Outer nuclear layer, µm | +38.3 | +23.29 | 0.03** | Change in Group 1 > group 2 |
| Photoreceptor complex, µm | +3.16 | +1.67 | 0.26 | Change in Group 1 > group 2 |
| Table 4:- Mean best corrected visual acuity (LogMAR) in both ERM groups during 12 weeks followup visits | ||||
| Baseline pre-operative, LogMAR(±SD) | Post-operative 6 weeks, LogMAR(±SD) | Post-operative 12 weeks, LogMAR(±SD) | P value | |
| Group 1-uniform adherent ERM | 0.70 (±0.35) | 0.39 (±0.31) | 0.32 (±0.31) | <0.001 |
| Group 2- ERM with cleavage | 0.52 (±0.18) | 0.32 (±0.19) | 0.29 (±0.20) | <0.001 |
Wilcoxon signed rank test
Figure 2:- Line Graph showing Mean best corrected visual acuity (LogMAR) in both ERM groups during 12 weeks followup visits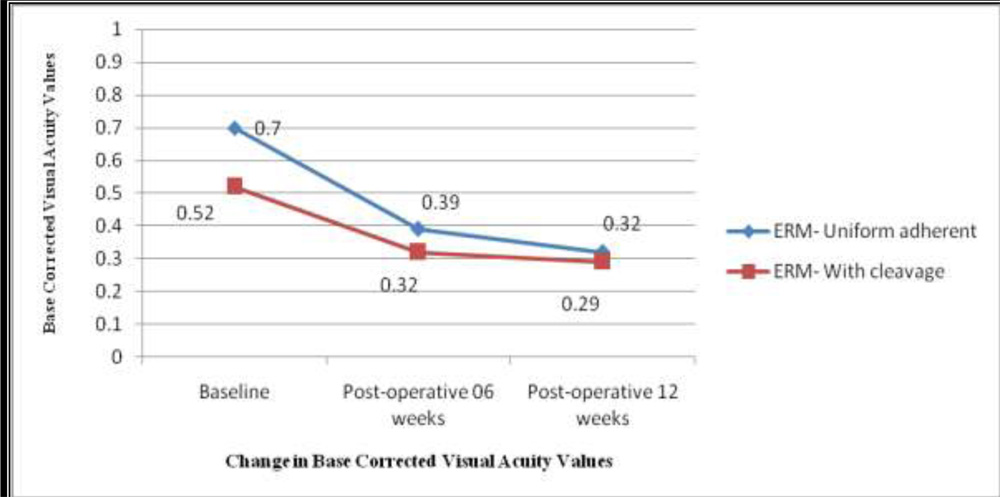
| Table 5:- Correlation between best corrected visual acuity (BCVA) with change in optical coherence tomography (SD-OCT) parameters | ||
| Correlation Coefficient | P-value | |
| Central retinal thickness (decreased)
Inner retinal layers (decreased) Outer nuclear layer (increased) Photoreceptor layer (increased) |
0.23
0.24 -0.16 -0.09 |
0.06
0.05 0.19 0.46 |
| Table 6:- Change in best corrected visual acuity (BCVA) with reference to inner segment-outer segment (IS-OS) loss | |||
| With pre-operatively existing ISOS loss (n=21) | Without pre-operatively existing IS-OS loss (n=43) | P-value | |
| Pre-operative mean BCVA (logMAR) | 0.857 | 0.530 | <0.001** |
| Post-operative mean BCVA (logMAR) | 0.633 | 0.160 | <0.001** |
 Discussion
Vitreous liquefies with age and separates from its posterior attachments resulting in posterior vitreous detachment (PVD), described in 95% cases of idiopathic ERM. Out of numerous theories proposed for IERM formation, classically accepted theory is that PVD causes breaks in internal limiting membrane (ILM) that allows migration of cells to inner surface of retina forming IERM. Another alternative theory says that anomalous PVD results in vitreoschisis and vitreoretinal traction resulting in remnants of cortical vitreous to stimulate migration of cells and IERM formation in an otherwise intact ILM in premacular area.2
Spectral domain optical coherence tomography (SD-OCT) uses low coherence, non-invasive high resolution cross-sectional optical interferometry to produce an image based on tissue density and back reflection from various tissue microstructures. Retinal OCT has reproducible and predictable hypo and hyper-reflective layers corresponding to the tissue makeup and boundaries of various retinal layers.2,3 Since retinal structure and thickness can change due to disease, a close look into various layers in SD-OCT may allow insights into disease or various therapeutic effects.
Adherent nature of ERM was directly proportional to CRT and IRL thickness but inversely proportional to ONL and PRC thickness. Most of the studies3,6 had shown significant positive correlation between improvement in best corrected visual acuity and decrease in central macular thickness postoperatively, but very few 3,6,11 documented change in different retinal layers after ERM removal surgery. Preoperatively increased inner retinal layer (IRL) thickness was correlated with better postoperative BCVA gains postoperatively.3,13,16 Studies3,6 documented decrease in thickness of all retinal layers postoperatively but, we observed that decrease in IRL thickness and increase in ONL thickness was correlated with BCVA improvement postoperatively while photoreceptor complex (PRC) thickness remained nearly same with BCVA improvement postoperatively. Contrary to this Shiono et al11 documented decrease in photoreceptor outer segment length postoperatively and no significant correlation of BCVA with CRT and ONL.
Preoperative macular thicknesses showed a positive correlation with post-operative BCVA improvement.3,5,15 Poorer BCVA in adherent ERM as compared to ERM with cleavage can be correlated with abnormally high OCT parameters which in turn provide more potential visual gain postoperatively.3 Postoperative reduction and restoration of macular thickness was significantly more in eyes with uniform adherent ERM as compared to eyes having ERM with cleavage. Though, BCVA change in ERM with cleavage eyes was comparatively less still, final post-operative BCVA improvement was better in ERM with cleavage eyes as compared to eyes with uniform adherent ERM.
Pre-operative presence of IS/OS junction is a important prognostic factor for good visual recovery after epiretinal membrane removal surgery. Pre-existing IS/OS junction disruption is not only associated with poor post-operative visual outcomes but also cause persistent IS/OS junction loss, even after retinal inner layers restoration following successful ERM removal surgery .2,5,13-18. Our study also showed post-operative improvement in best corrected visual acuity (BCVA) of 0.37 log MAR and mean final BCVA of 0.160 logMAR in eyes with pre-existing IS/OS junction as compared to 0.224 log MAR improvement and poorer mean final BCVA of 0.633 logMAR in eyes with pre-existing IS/OS loss, which significantly worsened visual outcome post-operatively.
Prolonged macular traction cause irreversible photoreceptor loss and change in alignment of cone cells which in return cause limited visual improvement in eyes with successful vitreo-macular interface disorder surgery for any vitreomacular interface disorder and that early intervention is required to prevent permanent photoreceptor impairment.5, 15
Limitation of our study is absence of normal control data; also we didn’t correlate various layers according to their reflectivity pixels data. As reference, we used thickest point of ERM adhesion in macula which also involved fovea. Another limitation is relatively short followup period post-operatively. Strength of this study is, good sample size and studying within short duration could give better postoperative visual assessment without much change in extra retinal parameters like change in cataract. Instead of reviewing only ISOS, we studied morphological changes in all layers of retina. Postoperative SD-OCT thickness might improve more towards normal with long term followup.
This study compared both patterns of ERM- uniformly adherent ERM and ERM with cleavage thickness on SD-OCT and to give comparative predictive results postoperatively in both of these groups. Cleavage in ERM attachment cause less retinal layers puckering and better postoperative results. Pre-operative higher central retinal thickness, hyper reflective inner retinal layers thickness and hypo reflective outer nuclear layer thickness was significantly correlated with improved postoperative visual acuity gains. There was no significant correlation between change in photoreceptor complex and best corrected visual acuity at any point of time. Presence of an intact IS/OS junction on preoperative SD-OCT was an important predictor with better visual recovery after epiretinal membrane removal surgery. Serial SD-OCT imaging from early postoperative period was needed to estimate structural and visual outcomes after epiretinal membrane removal surgery.
Bibliography
- Mitchell P, Smith W, Chey T, Wang JJ, Chang A. Prevalence and associations of epiretinal membranes. The Blue Mountains Eye Study, Australia. Ophthalmology. 1997;104(6):1033-1040.
- William S, Claudia M P P. Epiretinal membrane: optical coherence tomography-based diagnosis and classification. Clinical Ophthalmology 2016: 10;527-534.
- Kurian A E, DeBuc D C, Smiddy W E et al. Reflectivity and thickness analysis of epiretinal membranes using spectral-domain optical coherence tomography. Int J Ophthalmol, Vol. 9, No. 1, Jan.18, 2016.
- Hanhan Liu, Shanru Zuo et al. Comparison of the Effectiveness of Pars Plana Vitrectomy with and without Internal Limiting Membrane Peeling for Idiopathic Retinal Membrane Removal: A Meta-Analysis. Journal of Ophthalmology. Volume 2015, Article ID 974568, 10 pages.
- Suh MH, Seo JM, Park KH, Yu HG. Associations between macular findings by optical coherence tomography and visual outcomes after epiretinal membrane removal. Am J Ophthalmol 2009;147(3):473-480.e3.
- Treumer F, Wacker N, Junge O, Hedderich J, Roider J, Hillenkamp J. Foveal structure and thickness of retinal layers long-term after surgical peeling of idiopathic epiretinal membrane. Invest Ophthalmol Vis Sci 2011;52(2):744-750.
- Gao Y, Smiddy WE. Morphometric analysis of epiretinal membranes using SD-OCT. Ophthalmic sur lasers Imaging 2012;43(6 Suppl):S7-S15.
- De Bustros S, Thompson JT, Michels RG, Rice TA, Glaser BM. Vitrectomy for idiopathic epiretinal membranes causing macular pucker. Br J Ophthalmol 1988;72(9):692-695.
- Park DW, Dugel PU, Garda J, Sipperley JO, Thach A, Sneed SR, Blaisdell J. Macular pucker removal with and without internal limiting membrane peeling: pilot study. Ophthalmology 2003;110(1):62-64.
- Hillenkamp J, Saikia P, Gora F, Sachs HG, Lohmann CP, Roider J, Baumler W, Gabel VP. Macular function and morphology after peeling of idiopathic epiretinal membrane with and without the assistance of indocyanine green. Br J Ophthalmol 2005;89(4):437-443.
- Shiono A, Kogo J, Klose G, Takeda H, Ueno H, Tokuda N, Inoue J, Matsuzawa A, Kayama N, Ueno S, Takagi H. Photoreceptor outer segment length: a prognostic factor for idiopathic epiretinal membrane surgery. Ophthalmology 2013;120(4):788-794.
- Wilkins JR, Puliafito CA, Hee MR, Duker JS, Reichel E, Coker JG, Schuman JS, Swanson EA, Fujimoto JG. Characterization of epiretinal embranes using optical coherence tomography. Ophthalmology 1996;103(12):2142-2151.
- Michalewski J, Michalewska Z, Cisiecki S, Nawrocki J. Morphologically functional correlations of macular pathology connected with epiretinal membrane formation in spectral optical coherence tomography (SOCT).Graefes arch Exp Ophthalmol 2007;245(11):1623-1631.
- Oster SF, Mojana F, Brar M, Yuson RM, Cheng L, Freeman WR. Disruption of the photoreceptor inner segment/outer segment layer on spectral domain-optical coherence tomography is a predictor of poor visual acuity in patients with epiretinal membranes. Retina 2010;30(5): 713-718.
- Falkner-Radler CI, Glittenberg C, Binder S. Spectral domain high definition optical coherence tomography in patients undergoing epiretinal membrane surgery. Ophthalmic Surg lasers Imaging 2009;40 (3): 270-276.
- Watanabe k, tsunoda K, Mizno Y, Akiyama K. Outer retinal morphology and visual function in patirnts with idiopathic epiretinal membrane. JAMA Ophthalmol, 2013;131(2):172-177.
- Inque M, Watanabe S M Y et al. Inner Segment/Outer Segment Junction Assessed by Spectral-Domain Optical Coherence Tomography in Patients with Idiopathic Epiretinal Membrane. Am J Ophthalmol 2010;150:834–839.
- Cobos E, Arias L et al. Preoperative study of the inner segment/outer segment junction of photoreceptors by spectral-domain optical coherence tomography as a prognostic factor in patients with epiretinal membranes. Clinical ophthalmology 2013:7 1467–1470.