Dr. Aditya Modi, M17417, Dr. Naresh Kumar Yadav, Dr. Neha Sudhakar Peraka, Ms. Priyanka Chevour
ABSTRACT
Purpose:To establish correlations between aqueous humour biomarker levels and various patterns of diabetic macular edema (DME) on Spectral Domain Optical Coherence Tomography (SDOCT) in patients with varied response to intravitreal pharmacotherapy.
Design: Retrospective, interventional, case control study.]=-
Subjects: Fifty-eight eyes of 58 patients with DME and 14 eyes of 14 patients undergoing uneventful cataract surgery served as cases and controls respectively. Eyes with DME are classified according to their response to intravitreal pharmacotherapy as non-responders(n=33), responders (n=15) and treatment naive (n=10), same arefurther classified based on different morphological patterns on SDOCT as those demonstrating predominantly sponge like diffuse retinal thickening (SDRT) (n=14), predominantly cystoid macular edema (CME) (n=26), sub retinal detachment (SRD) (n=15) and mixed pattern (n=3).
Methods: Aqueous tap and SDOCT imaging are performed in eyes with DME before administering intravitreal therapy while that in control group, at the beginning of cataract surgery and concentration of 18 aqueous biomarkers are analysed using multiplex bead assay and analysed using SPSS V.17.0 for Windows.
Outcome measures: Main outcome measures are determining correlation between aqueous biomarker concentrations with response to intravitreal pharmacotherapy and various tomographic presentations.
Results: Cases and controls were matched for demographic characteristics. Majority of non-responderspresented with CME pattern and had significant increase in aqueous levels of IL8, IP10, IL1b, MCP, MIP1β, ICAM1, VCAM1, Fractalkine. Similarly, responders presented with SDRTand had raised aqueous concentrations of IL1b, IL17F, ICAM1, VCAM1, Fractalkine as compared to controls. Mean VEGF levels were high in SDRT and CMEgroup and mean IL6 levels were high in SRD and CME group as compared to controls though statistically not significant
Conclusions:Specific aqueous cytokines are observed to have an important role in developing non responding DME which might explain the variable response to different intravitreal therapy and form a potential predictors of conversion of majority of treatment naïve DME patients into non-responders. Certain cytokines are related to a particular OCT pattern which helps in customizing the therapy using SDOCT as a non invasive tool
INTRODUCTION:
Diabetic retinopathy is a leading cause of visual morbidity globally. Diabetes is projected to affect 592 million people worldwide by 2035 where at present, there are 382 million diabetic persons in theworld1,and 10% are afflicted with visual threatening diabetic retinopathy2where Diabetic Macular Edema (DME) remains the major cause of vision loss in the highly prevalent type 2 diabetes3and is invariably associated with Proliferative Diabetic Retinopathy (PDR) in type 2 diabetes4 with25 years cumulative incidence of DME and Clinically Significant Macular Edema (CSME)being 29% and 17%5respectively.
The pathogenesis of DMEis multifactorial with a major componentbeing chronic low grade inflammatory pathway with upregulation of proinflammatory factors like vascular endothelial growth factor (VEGF), intercellular adhesion molecule (ICAM)-1, interleukin (IL)-6, and monocyte chemotactic protein (MCP)-1, or the downregulation of anti-inflammatory factors, such as pigment epithelium-derived factor (PEDF) which in turn leads to increase in leukocyte-endothelial interaction contributing to breakdown of the blood retinal barrier6-10. Current literature has demonstrated upregulation of inflammatory cytokines in the serum11, vitreous humor12, aqueous humor13,14, and tear samples15of patients with diabetic retinopathy. Future directions of intravitreal therapy involves targeting predominant cytokine responsible in causation of DME. But we are limited by the invasive nature of the procedure to acquire intraocular fluid samples and cost of analysing it which directs our attention towards the available newernon-invasiveimaging modalities like spectral domain optical coherence tomography (SD-OCT) with their better resolution approaching that of histological sections which forms the mainstay in analysing microstructual alterations in diabetic macular edema16-18. This creates a stronger task to determine a new diagnostic approach for targeted treatment of DME. Current study outlines a new diagnostic outlook where aqueous profile of various cytokines in DME are analysed and different tomographical patterns of DMEare established and correlation between cytokines and different morphologic patterns of DME in eyes with varied response to therapy was determined
PATIENTS AND METHODS:
Study population
This study followed a retrospective cross sectional case control comparative design.Patients were recruited at a single centre between January 2014 and August 2015.The study was approved by theInstitutional Review Board and wasperformed in accordance with the Helsinki Declaration of 1975 (1983 revision). Informed consent was obtained from all participants.
Inclusion criteria were (1) patients older than 18 years of age (2) Central foveal thickness (CFT) ≥ 250 µm, asdocumented on SDOCT. Exclusion criteria were(1) Concomitant macular pathologies apart from diabetic retinopathy (2) patients with underlying neovascularisation (3) prior ocular surgery or laser photocoagulation within three months of recruitment. All patients underwent a complete ophthalmic examination that included Corrected Distance visual acuity (CDVA) using Snellens chart, slit-lamp examination, indirect ophthalmoscopy, intraocular pressure measurement by applanation tonometry, andspectral domain optical coherence tomography(HRA 2, Heidelberg Engineering, Vista, California, Germany)
DME patients were classified depending on varied response to therapy which included responders (n=15), nonresponders (n = 33) and treatment naive (n=10). Treatment naïve are eyes who have not undergone any treatment previously for DME. Responders are defined as eyes whose central foveal thickness has decreased by >30% from baseline with less than 2 successive intravitreal injections. Non responders included eyes which received more than three successive intravitreal injections and the central foveal thickness has either worsened or decreased by < 30% from baseline and recurrent cases where initially CFT decreased by >30% from baseline and reappeared by increase in edema by >30% within 3 months
Sample collection methodology:
Aqueous samples from age matched patients undergoing cataract surgery without other ocular or systemic diseases were collected as controls.
Undiluted aqueous humour samples (50–100µl) were obtained by an experienced surgeon just before an intravitreal injection in eyes of patients with DME and before anterior chamber entry during routine cataract surgery in controls.Aqueous humour is withdrawn through a limbal paracentesis site using a 30-gauge needle in a tuberculin syringe after insertion of lid speculum. All sample collections were conducted under sterile conditions in the operating room and samples were stored at – 80oC.
Sample Analysis:
Aqueous humour biomarkers like Vascular endothelial Growth Factor (VEGF), TGF1β (Transforming Growth factor 1 beta), Interleukins like IL2,IL4, IL6, IL8, IL17F, IL1a, IL1b, Cell adhesion Molecules like Intracellular Adhesion Molecules (ICAM1), Vascular Cell Adhesion Molecule 1(VCAM1), L – Selectin , Chemokines like Monocyte chemoattractant Protein (MCP1), Macrophage Inflammatory Protein 1 beta (MIP1β), Interferon gamma induced protein 10 (IP 10), Interferon alpha(IFN α), Angiogenin, Fractalkine concentrations were determined using multiplex bead assay (BD Cytometric Bead Array)which consist of capture beads, detection reagent and their respective standards. The assay is performed and analysed according to manufacturer’s instructions. Briefly, 50µl of capture beads are mixed with 50µl of the standards or test sample and incubated for 1 hour in the dark at room temperature. After the addition of detection bead, the mixture is further incubated for 2 hours in the dark at room temperature. The mixture is then washed with 1 ml of wash buffer at 300 revolutions per minute for 5 min. The pellet is then resuspended in 300µl of wash buffer. The flow cytometer (BDFACS Calibur) is calibrated with set up beads and the samples are analysedusing BD Cell Quest Pro Software (Version 6.0).Individual analyte concentrations are indicated by their fluorescent intensities and are computed by using the standard reference curve with the help of BD FCAP Array Software (Version 3).
Tomographic analysis:
Spectral domain optical coherence tomographic images were obtained post dilatation of pupil. The camera used an internal fixation source centered on the patient’s fovea. The operator independently monitored the stability of fixation with incorporated infrared camera. The images were generated using 25 linefast raster (30ﹾ × 20ﹾ), 12 Macular Radial Scans centered at the fovea at equally spaced angular orientationsand EDI scan (enhanced depth imaging).
Retinal thickness was generatedusing inbuilt automated software which defines it as distance between the 2 interfaces(the vitreoretinal interface and at the basement membrane of the retinal pigment epithelial (RPE)–Bruch membrane complex) at each measurement point along the scan’s x-axis. RT map analysis protocol was usedtocompute numeric averages of the measurements for each of the 9 subfields as defined by the Early Treatment Diabetic Retinopathy Study (ETDRS)14.Average of all points within the inner circle of 1mm radius was defined as central foveal subfield (CFT) thickness.
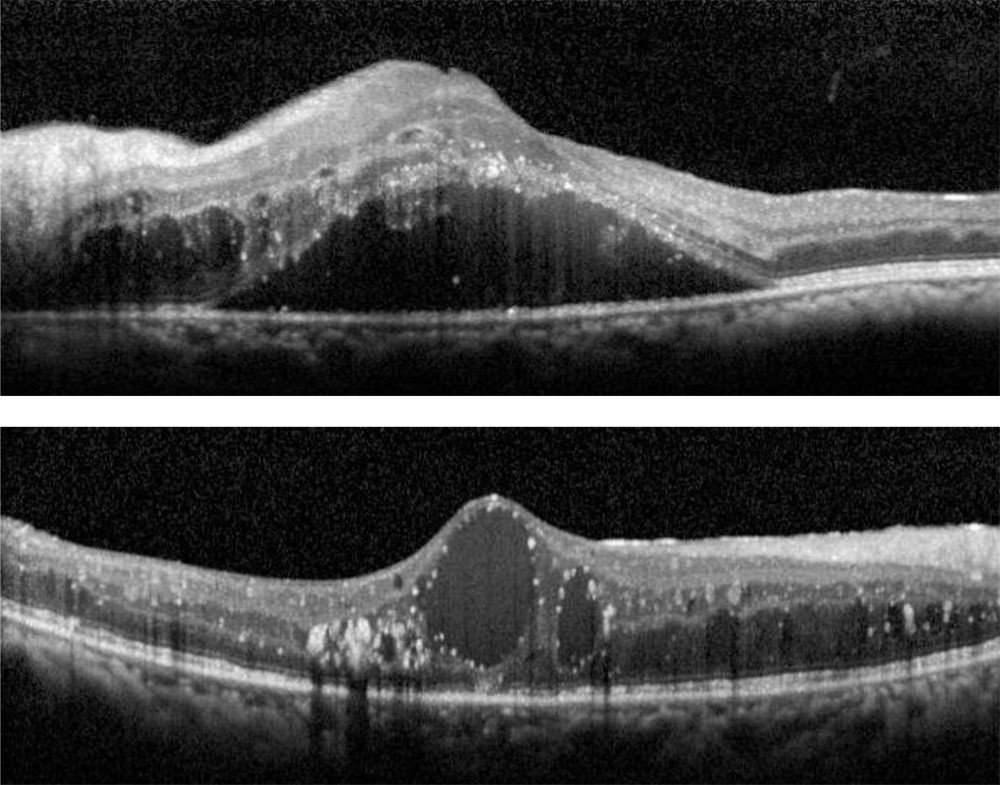
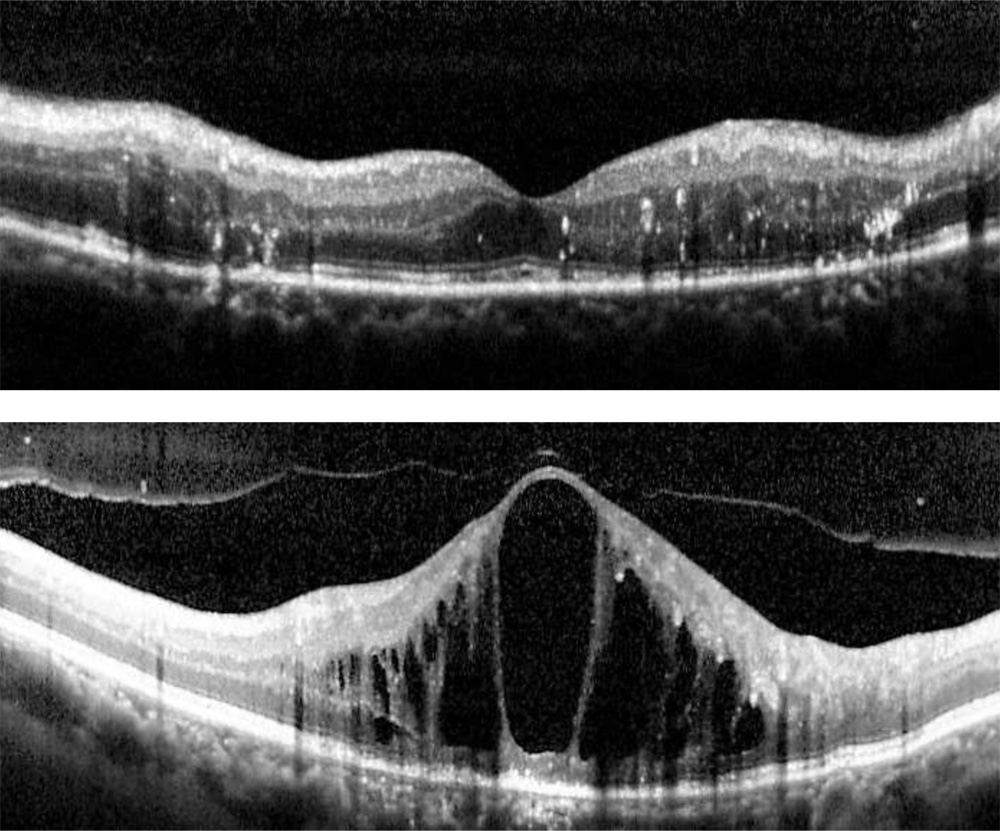
Morphological tomographic patterns:All OCT scans were graded for the presence of specific patterns: a) Predominantly Diffuse Retinal Thickening (diffuse retinal thickening which was defined asincreased retinal thickness with reduced intraretinal reflectivity and expanded areas of lower reflectivity), b)Predominantly Cystoid Macular Edema (localization of intraretinal cystoid-like spaces that appeared as round or oval areas of low reflectivity with highly reflective septa separating the cystoid-like cavities), c) Subretinal fluid Detachment ( accumulation of fluid in subretinal space. The identification of highly reflective posterior border of detached retina distinguished subretinal from intraretinal fluid) and d) Mixed pattern (equitable presence of SDRT and cystoid spaces)
Layer of retina with predominant fluid accumulation: Four layers were identified which were inner intraretinal(Between outer plexiform layer and inner nuclear layer) ,outer intraretinal ( Between outer plexiform layer and outer nuclear layer) , subretinal and mixed ( equitable presence of fluid in inner and outer intraretinal space)
All the measurements were made by three experienced examiners who were masked to clinical, angiographic or functional status of the patients. If the measurements by the 2 examiners differed by more than 15%, the examiners repeatedthe measurements together.Cases in which three authors did not agree with types of DME or it was difficult to define the pattern were excluded.
Primary outcome measure was to establish a correlation between mean cytokine concentration levels andDME groups classified according to varied response to therapy and different DME tomographic patterns in different groups.
Statistical Analysis:
All analyses were performed with SPSS V.17.0 for Windows. Data are presented as the mean with standard deviation.Mann–Whitney U and Kruskal–Wallis Tests (nonparametric analysis of variance) were used to analyze the different cytokine concentrations between groups and different tomographic patterns of DME.Univariate and multivariate binomial logisticregression was used to identify correlations between aqueous cytokine concentration and the development of each patternand groups of DME. To assess the relationship between cytokines and CFT, layer involvedSpearman’s rank‑order correlation coefficients were calculated.A (P < 0.05) was considered statistically significant.
RESULTS
A total of fifty-eight eyes with DME were assigned as DME group and fourteen
eyes undergoing cataract surgery were assigned as control group.
Study population:
Baseline demographic characteristics of both the groups are summarised in Table 1. The DME group which are further classified depending on the tomographic pattern of edema and varied response to therapy were age matched in respect to controls(p = 0.110 ) and also in between the groups(p = 0.156) .There was no significant difference in between the DME patterns and control group in respect to duration of diabetes (p = 0.227 ) , presence of hypertension (p = 0.904) , fasting blood sugar levels(p =0.159 ), post prandial blood sugar levels (p=0.089) , glycosylated hemoglobin levels.(p=0.078) Baseline Best Corrected Visual Acuity( p = 0.24) , Central foveal thickness(p = 0.10) , Sub foveal Choroidal thickness (p = 0.76) did not vary significantly in between the groups.DME patients were classified depending on varied response to therapy which included responders (n=10), nonresponders (n=14) and treatment naive (n=14) (Table 4). Different tomographic patterns of the study group presented as SDRT in 14 eyes, CME in 26 eyes, SRD in 15eyes and Mixed pattern in 3 eyes.
| SDRT | CME | SRD | MIXED | CONTROLS | P value*
(Among DME patterns) |
|
| Patients(n) | 14 | 26 | 15 | 3 | 14 | – |
| Age (years) | 59.5+/-8.18 | 64.35+/-6.343 | 60.13+/-6.98 | 60.00+/5.56 | 57.36+/-10.30 | 0.15 |
| Duration of Diabetes (Years) | 14 | 26 | 15 | 3 |
– |
0.22 |
| FBS (mg/dl) | 124+/-59.06 | 133+/-38.90 | 125.67+1.41 | 131.67+/-19.553 | – | 0.16 |
| PPBS (mg/dl) | 206.21+/-59.06 | 202.42+/-58.73 | 182.20+/-68.8 | 130.0+/-63.78 | – | 0.09 |
| HbA1c (%) | 7.4+/-0.82 | 8.06+/-1.35 | 7.9+/-1.36 | 7.43+/-1.23 | – | 0.10 |
| Hypertension (yes/no) | 8/6 | 14/12 | 8/7 | ½ | – | 0.90 |
| BCVA (log MAR,
Snellen’s equivalent) |
0.69+/-0.36 (6/8.7) | 0.52+/-0.29 (6/11.5) | 0.76+/-0.45
(6/7.9) |
0.55+/-0.25 (6/11) | – | 0.41 |
| CFT (microns) | 436.42+/-157.58 | 501.077+/-103.16 | 555.467+/-150.13 | 475.0+/-200.36 | – | 0.10 |
TABLE 1:Baseline demographic and clinical characteristics: Spectral domain optical coherence tomography based diabetic macular edema patterns and control groups.
| DME: Diabetic Macular Edema; SDRT: Sponge like Diffuse Retinal Thickening; CME: Cystoid Macular Edema ; SRD: Serous Retinal Detachment; Mixed: Combination of CME and SDRT; FBS: Fasting Blood Sugar Levels; PPBS: Post Prandial Blood Sugar Levels; HbA1c: Glycosylated Haemoglobin; BCVA: Best Corrected Visual Acuity (logMAR: logarithm of the Minimum Angle of Resolution); CFT: Central Foveal Thickness.
*Kruskal-Wallis test |
| SDOCT based DME patterns | Response to therapy | Total | |||
| Non responders | Treatment naive | Responders | |||
| SDRT (n,%) | 8 | 3 | 3 | 14 | |
| 24.2% | 30.0% | 20.0% | 24.1% | ||
| CME
(n,%) |
15 | 6 | 5 | 26 | |
| 45.5% | 60.0% | 33.3% | 44.9% | ||
| SRD
(n,%) |
9 | 0 | 6 | 15 | |
| 27.3% | 0% | 40.0% | 25.9% | ||
| MIXED (n,%) | 1 | 1 | 1 | 3 | |
| 3.0% | 10.0% | 6.7% | 5.2% | ||
| TOTAL
(n,%) |
33 | 10 | 15 | 58 | |
| 100% | 100% | 100% | 100.0% | ||
Table 4: Relationship between spectral domain optical coherence tomography baseddiabetic macular edema patterns and varied response to therapy
DME: Diabetic Macular Edema; SDRT: Sponge like Diffuse Retinal Thickening; CME: Cystoid Macular Edema pattern; SRD: Serous Retinal Detachment
Mean Aqueous concentrations of 18 cytokines of DME group and controls are listed in Table 2. Out of 18 measured cytokine values, 9 cytokines were significantly higher in aqueous humour of patients in DME group than in control subjects which include IL8, IL 17F, ICAM1, VCAM1, Fractalkine, MCP1, IP 10, MIP1b, IL 1b. The relation of CFT and the aqueous levels of cytokines was analysed in each group. TGF1β (p=0.01) and MCP1 (p=0.03) correlated positively with CFT in CME group. TGF1β (p=0.03) and IL2 (p=0.01) correlated positively with CFT in Mixed group. None of thecytokine levels, however, correlated significantly with CFT in any of the SDRT and SRD groups.
| Aqueous biomarkers | DRT
|
CME
|
SRD
|
MIXED
|
CONTROL
|
P value*
(DME VS CONTROLS) |
| IL2** | 23.43+/-13.45 | 19.94+/-14.03 | 19.98+/-14.00 | 13.25+/-13.026 | 19.75+/-16.03 | 0.97 |
| IL4** | 3.32+/-1.42 | 5.46+/-5.27 | 4.46+/-4.72 | 1.85+/-2.01 | 3.77+/-2.52 | 0.80 |
| IL6** | 30.50+/-53.67 | 344.76+/-1455.12 | 432.19+/-1069.20 | 2.51+/-4.34 | 2.41+/-6.19 | 0.21 |
| IL8** | 41.59+/-50.31 | 29.59+/-42.35 | 44.12+/-70.58 | 13.03+/-6.47 | 5.99+/-6.27 | 0.003 |
| IL1a** | 263.909+/-984.32 | 60.8+/-284.01 | 2.40+/-3.71 | 2.56+/-3.41 | 3.36+/-4.12 | 0.07 |
| IL1b** | 14.01+/-5.04 | 13.96+/-6.55 | 14.78+/-7.84 | 13.81+/-5.65 | 21.42+/-9.66 | 0.02 |
| IL17F** | 4.45+/-5.56 | 5.60+/-8.50 | 9.24+/-9.43 | 10.03+/-9.78 | 27.58+/-27.83 | 0.04 |
| IP10** | 58.88+/-87.36 | 34.72+/-41.92 | 43.11+/-48.06 | 56.59+/-54.70 | 8.89+/-12.74 | 0.005 |
| VEGF** | 84.69+/-110.88 | 71.28+/-70.299 | 59.40+/-85.10 | 54.01+/-31.90 | 39.04+/-22.07 | 0.68 |
| TGFβ1** | 34646.01+/-104664.16 | 23688.19+/-58861.66 | 19261.99+/-48336.5 | 8871.25+/-13870.95 | 1217.65+/-3311.11 | 0.33 |
| MCP1** | 1037.30+/-863.29 | 1263.75+/-1374.785 | 1963.94+/-2985.82 | 899.53+/-588.49 | 448.82+/-322.32 | 0.003 |
| MIP1β** | 13.66+/-25.48 | 17.21+/-32.87 | 11.08+/-16.66 | 12.14+/-19.03 | 0.48+/-0.86 | 0.002 |
| IFNα** | 142.73+/-297.92 | 1540.99+/-7555.13 | 640.00+/-1573.55 | 17.75+/-21.59 | 226.57+/-623.43 | 0.44 |
| ICAM1** | 691.53+/-583.43 | 601.11+/-652.91 | 555.75+/-736.22 | 528.76+/-324.66 | 87.38+/-54.36 | 0.001 |
| VCAM1** | 6134.21+/-9072.83 | 4013.36+/-5552.66 | 3489.60+/-5695.43 | 811.33+/-992.46 | 572.52+/-491.56 | 0.001 |
| CD62 L** | 3250.10+/-4868.39 | 1772.42+/-2128.82 | 2612.37+/-4189.99 | 972.19+/-1221.92 | 923.97+/
-896.22 |
0.20 |
| ANGIOGENIN** | 2832.09+/-3735.82 | 2928.02+/-3364.47 | 2503.6+/-4189.99 | 4114.09+/-4306.50 | 2133.43+/-1485.60 | 0.74 |
| FRACTALKINE** | 937.61+/-729.41 | 954.86+/-1003.12 | 737.66+/-1022.75 | 635.32+/-743.39 | 229.90+/-446.09 | 0.005 |
TABLE 2:Baseline aqueous biomarker levels in spectral domain optical coherence tomography based diabetic macular edema patterns and control group
DME: Diabetic Macular Edema; SDRT: Sponge like Diffuse Retinal Thickening; CME: Cystoid Macular Edema pattern; SRD: Serous Retinal Detachment; Mixed: Combination of CME and SDRT
IL: Interleukin; VEGF: Vascular Endothelial Growth Factor; TGFβ1: Transforming Growth Factor beta 1; MCP: Monocyte Chemoattractant Protein; MIP: Macrophage Inflammatory Protein 1 beta; IFNα; Interferon alpha; ICAM1: Intracellular Adhesion Molecule 1; VCAM1: Vascular Cell Adhesion Protein 1; CD62L: L Selectin;
*Kruskal-Wallis test
** Values in picograms /millilitres ( mean ± Standard Deviation)
Fluid accumulation was predominantly seen in outer layers in 27 eyes and involving both inner and outer layers in 27 eyes(p=0.02). IL4 (p=0.02) was significantly higher in eyes with involvement of both inner and outer layers while Fractalkine (p=0.02) was higher in eyes with outer layer involvement. Non responders had majority of fluid accumulation in inner layers (70%). Outer layer fluid accumulation was noted exclusively in treatment naïve and responders (100%).
Correlation between DME groups classified according to varied response to therapy and Aqueous biomarker levels
In DME eyes which were classified depending on varied response to therapy, included Treatment naïve (n=10), Responders ( n=14) and non-responders (n= 33). The most common OCT pattern observed in nonresponders and treatment naïve patients was CME while SRD was noted commonly in responders.
Aqueous levels of 18 cytokines were analysed in various groups. Non responders had significant increase in levels of IL8 (p=0.001), IP 10(P=0.001), IL1b(p=0.01),MCP1(p=0.001),MIP1β(p=0.001),ICAM1(p=0.001),VCAM1(p=0.001),Fractalkine(p=0.01).The mean aqueous levels of IL8(p0.03) , IL1a(p=0.04), IP10(p=0.02), TGFβ(p=0.004), MIP1β(p=0.007), ICAM1 (p=0.001), Fractalkine(p=0.001) were significantly higher in treatment naïve group and similarly only ICAM1 (p=0,002) levels were higher in responders as compared to controls. There was significant difference in between the mean values of IL6(p=0.03), IL8(p=0.003), TGFβ(p=0.009), MIP1β(p=0.007), ICAM1(p=0.03) in between the groups(Table5).
| Aqueous biomarkers | Non responders
|
P value *
(NR vs CONTROLS) |
Treatment naive
(mean± SD) |
P value*
(TN vs CONTROLS) |
Responders
(mean± SD) |
P value*
(R vs CONTROLS) |
CONTROL
(mean± SD) |
Pvalue†
(among DME groups) |
| IL2** | 20.26+/-12.50 | 0.91 | 28.63+/-9.51 | 0.48 | 15.42+/-16.43 | 0.52 | 19.75+/-16.03 | 0.03 |
| IL4** | 4.79+/-5.06 | 0.88 | 5.77+/-3.89 | 0.37 | 3.02+/-5.57 | 0.25 | 3.77+/-2.52 | 0.05 |
| IL6** | 473.51+/-1451.91 | 0.07 | 9.45+/-19.94 | 0.86 | 10.73+/-37.61 | 0.79 | 2.41+/-6.19 | 0.20 |
| IL8** | 49.01+/-61.75 | 0.001 | 31.32+/-35.34 | 0.03 | 8.12+/-8.09 | 0.51 | 5.99+/-6.27 | 0.003 |
| IL1a** | 49.06+/-252.09 | 0.31 | 0.73+/-1.33 | 0.04 | 246.20+/-950.99 | 0.05 | 3.36+/-4.12 | 0.32 |
| IL1b** | 13.20+/-5.66 | 0.01 | 16.99+/-8.65 | 0.42 | 14.45+/-6.13 | 0.19 | 21.42+/-9.66 | 0.40 |
| IL17F** | 4.45+/-5.56 | 0.061 | 2.18+/-4.41 | 0.36 | 7.66+/-7.54 | 0.27 | 27.58+/-27.83 | 0.16 |
| IP10** | 51.75+/-59.71 | 0.001 | 44.83+/-48.31 | 0.02 | 25.82+/-56.85 | 0.32 | 8.89+/-12.74 | 0.05 |
| VEGF** | 85.63+/-97.95 | 0.35 | 48.98+/-37.68 | 1.0 | 51.76+/-62.69 | 0.63 | 39.04+/-22.07 | 0.51 |
| TGFβ1** | 17736+/-69249.50 | 0.69 | 59216+/-84318.93 | 0.004 | 15836+/-48269 | 0.93 | 1217.65+/-3311.11 | 0.009 |
| MCP1** | 1748.9+/-2221.27 | 0.001 | 1208.6+/-1331.69 | 0.06 | 649.11+/-506.96 | 0.35 | 448.82+/-322.32 | 0.02 |
| MIP1β** | 22.63+/-32.95 | 0.001 | 4.93+/-4.82 | 0.007 | 3.02+/-5.57 | 0.41 | 0.48+/-0.86 | 0.007 |
| IFNα** | 1430.2+/-6748.98 | 0.54 | 43.81+/-62.15 | 0.45 | 272.16+/-583..14 | 0.51 | 226.57+/-623.43 | 0.92 |
| ICAM1** | 707.50+/-704.80 | 0.001 | 752.65+/-688.25 | 0.001 | 290.58+/-244.07 | 0.002 | 8+/-887.38+/-54.36 | 0.03 |
| VCAM1** | 5656.09+/-7827.07 | 0.001 | 4162.62+/-4801.64 | 0.003 | 1115.15+/-912.98 | 0.01 | 572.52+/-491.56 | 0.05 |
| CD62 L** | 2916.17+/-4357.22 | 0.10 | 2112.70+/-2081.73 | 0.30 | 1088.38+/-1047.99 | 0.91 | 923.97+/-896.22 | 0.44 |
| ANGIOGENIN** | 3503.98+/-3836.13 | 0.40 | 1977.71+/-3301.77 | 0.59 | 2017.73+/-2171.95 | 0.86 | 2133.43+/-1485.60 | 0.56 |
| FRACTALKINE** | 755.05+/-767.53 | 0.01 | 1370.59+/-1077.26 | 0.002 | 820.08+/-1076.58 | 0.10 | 229.90+/-446.09 | 0.20 |
| DME: Diabetic Macular Edema; NR: Non Responder; TN: Treatment Naïve; R: Responder
IL: Interleukin; VEGF: Vascular Endothelial Growth Factor; TGFβ1: Transforming Growth Factor beta 1; MCP: Monocyte Chemoattractant Protein; MIP: Macrophage Inflammatory Protein 1 beta; IFNα; Interferon alpha; ICAM1: Intracellular Adhesion Molecule 1; VCAM1: Vascular Cell Adhesion Protein 1; CD62L: L Selectin; *Kruskal-Wallis test †Mann-Whitney test **Values in picograms /millilitres (mean ± Standard Deviation) |
TABLE 5: Relationship between baseline aqueous humour biomarker levels and varied response to therapy
Correlation between Tomographic pattern of DME and aqueous biomarker levels
Univariate Logistic Regression was used to identify correlation between cytokine levels and pattern of edema. Patients with SDRT were at higher risk of having raised aqueous concentrations of IL1b (p=0.03),IL17F(p=0.03), ICAM1(p=0.03), VCAM1(p=0.02), Fractalkine (p=0.01) as compared to controls (Table 3)and the difference was found to be statistically significant. Similarly, IL1b(p=0.01), MCP1(p=0.02),IL17F(p=0.007), ICAM1(p=0.01),VCAM1(p=0.03), Fractalkine (p=0.03) were associated with CME(Table 3). IP10(p=0.04), IL17F(p=0.04), ICAM1(p=0.04) were associated with SRD and the correlation was statistically significant(Table 3). Mean aqueous VEGF levels were high in SDRT (84.69pg/ml) and CME (71.28pg/ml) group.Similarly, aqueous IL6 levels were high in SRD (432.197pg/ml) and CME (344.764pg/ml) group as compared to controls but were statistically not significant due to small sample size and wide range of standard deviation.
| DME PATTERN | VARIABLES | P value* | ODDS RATIO | 95% C.I | |
| Lower | Upper | ||||
| SDRT | IL1β | 0.033 | 1.139 | 1.011 | 1.284 |
| IL17F | 0.037 | 1.070 | 1.004 | 1.140 | |
| ICAM1 | 0.023 | 0.971 | 0.947 | 0.996 | |
| VCAM1 | 0.022 | 0.998 | 0.996 | 1.000 | |
| FRACTALKINE | 0.015 | 0.998 | 0.997 | 1.000 | |
| CME | IL1β | 0.014 | 1.123 | 1.024 | 1.232 |
| MCP1 | 0.025 | 0.998 | 0.996 | 1.000 | |
| IL17F | 0.007 | 1.064 | 1.017 | 1.112 | |
| ICAM1 | 0.013 | 0.980 | 0.965 | 0.996 | |
| VCAM1 | 0.034 | 0.999 | 0.998 | 1.000 | |
| FRACTALKINE | 0.036 | 0.999 | 0.997 | 1.000 | |
| SRD | IL17F | 0.040 | 1.047 | 1.002 | 1.093 |
| ICAM1 | 0.049 | 0.983 | 0.966 | 1.000 | |
TABLE 3: Aqueous humour biomarkers and spectral domain optical coherence tomography based diabetic macular edema patterns, demonstrating statistically significant associations as determined by age and sex adjusted logistic regression analysis
| DME: Diabetic Macular Edema; SDRT: Sponge like Diffuse Retinal Thickening; CME: Cystoid Macular Edema pattern; SRD: Serous Retinal Detachment
IL: Interleukin; MCP: Monocyte Chemoattractant Protein; ICAM1: Intracellular Adhesion Molecule 1; VCAM1: Vascular Cell Adhesion Protein 1; C.I: Confidence Interval *P value –Correlation between DME and SDOCT patterns *Univariate or Multivariate binomial logistic regression analysis |
Multiple mechanisms like light scattering, impaired cell-to-cell interaction, and disturbances of normal ionic balances regulated by multifactorial feedback loops in the retina contribute to DME19. At molecular level, DME is a state of low-grade chronic inflammation. Many studies have demonstrated significant levels of multiple cytokines in causation of diabetic retinopathy and DME but interactions and implications of these cytokines in pathogenesis of DMEare complex and poorly understood making DME a clinical treatment dilemma11-15. Funatsu et al evaluated the vitreous inflammatory factors and its association with severity of DME where they found a positive association with cytokines like VEGF20-23, ICAM120,22, MCP120, IL620,21while negative association PEDF20,23.
Sohn et al investigated the influence of intravitreal therapy on aqueous cytokine levels in DME24.Fundamental Role of VEGF as a source of vascular permeability in DME by opening endothelial tight junctions and inducing fenestration and vesicle vacuolar organelles has led to emergence of Anti VEGF therapy as first line therapy in DME. The role of inflammation in the pathogenesis of DME is hypothesized given its known role in vasopermeability, and more recently based on the efficacy of intravitreal steroid treatment of DME.But intravitreal steroid therapy is associated with varied side effects like rise in IOP and cataract formation. A study by Roh et al25 showed that recurrent cases of CSME are associated with lower concentrations of VEGF as compared to IL 6 and MCP 1 levels. This builds a hypothesis that cytokines have predominant role in causation of DME and can form a potential alternative, and more targeted strategy to address the inflammatory component of DME with fewer side effects. We obtained similar results in our study as shown in previous studies in relation to intraocular cytokine levels and DME.
Though there is lot of inter relations among different cytokines which are dependent on each other for activation and expression, if these are the actual mechanisms, targeting an individual factor may have a major impact on the overall macular edema.
It is crucial to identify responders and non-responders to therapy for DME as we can devise a more targeting treatment approaches. So it is pivotal that we determine different modalities to recognize these patients who are not responding to therapy. Determining a relationship between DME patients with varied response to therapy, OCT patterns and biomarkers may serve a key role in predetermining the treatment and its outcome, which also serves as a guide for future prognosis. In our study we correlated the Biomarker levels with DME patients with varied response to therapy. We found that majority of inflammatory cytokines elevated in Non-respondergroup as compared to treatment naïve and responder group. We also found that CME is the most common presenting pattern of edema in treatment naïve and non-responder group. Inflammatory cytokines like IL8, IP10, ICAM1, MIP1b, Fractalkine are noted significantly high in both treatment naïve and non-responder group but the levels are significantly higher in non-responder as compared to treatment naïve. This signifies that patients presenting early in disease with elevation of these cytokines are more liable to conversion into non responders. Thus, these cytokines form a new era of diagnostic modality for future predilection of disease progression
We demonstrated a correlation between the aqueous biomarker levels and the tomographic patterns of DME in patients with varied response to therapy. SDRT group had increase in aqueous IL1b, IL17F, ICAM1, VCAM1, Fractalkine as compared to controls.Similarly, IL1b, MCP1, IL17F, ICAM1, VCAM1, Fractalkine were elevated in CME and IP10, IL17F, ICAM1 were associated with SRD and the correlation was statistically significant. Statistically no significant difference was found in VEGF levels in between the patterns due to small sample size. Kim et al reported that specific aqueous cytokines may play an important role in developing each DME pattern based on OCT and intravitreal injection of bevacizumab was more effective in the SDRT type than in the CME or SRD types of DME as VEGF levels were reported high in SDRT group as compared to increase in IL6 in SRD and IL6 and MCP 1 in CME groups respectively26. A similar study reported thatthe levels of inflammatory cytokines were higher in the CME or SRD groups than in the SDRT group and there was no significant difference in VEGF levels were noted among the tomographic patterns. This might explain the variable response to treatments such as intravitreal bevacizumab or triamcinolone injection27.Though our findings are similar to the above studies we had low levels of VEGF in all tomographic patterns suggesting paradigm shift of biomarkers towards inflammatory pathways.
Monocyte chemoattractant protein 1 (MCP-1) is a chemokine that induces monocyte and macrophage infiltration into tissue which further promote vascular permeability potentiating DME28. Previous studies demonstrated a statistically significant correlation between the levels of aqueous29 and vitreous30MCP-1 and the severity of DME. In our study we observed significantly higher levels in CME group compared to controls.
Role of ICAM130,31 and VCAM1 are well established in pathogenesis of DME.Cell adhesive molecules like ICAM1 and VCAM1 which are activated by leukostasis mainlyhelp in adhesion of leucocytes with vascular endothelial cellswhich in turn directly induce endothelial cell death in capillaries, causing vascular obstruction and vascular leakage32.ICAM 1 was noted high in all the tomographic patterns (SDRT, CME, SRD) while VCAM1 was high in CME and SDRT groups.
Fractalkine is a versatile molecule which regulates cell to cell interaction. It is induced on primary endothelial cells by inflammatory cytokines which in turn causes robust adhesion of monocytes and T lymphocytes33. Initial studiesdemonstrated that FKN may mediate retinal angiogenesis via inflammatory mechanisms in diabetic retinopathy34.Fractalkine was significantly high in SDRT and CME group as compared to controls.Role of fractalkine in DME has not been well established.
In DR, high level of glucose induces IL-1β production in retinal vascular endothelial cells IL-1β caused a significant increase of the production of IL-8 via MAPK and ERK1/2 pathways, rather than JNK1/2 orJAK2/STAT3 pathways35,36which is an important cytokine related to causation of DME. A study37 showed that TA suppressed VEGF expression induced by IL-1b in Müller cells at the transcriptional level. In our study we found significant correlation between IL1β with IL2(p=0.009), IL4(p=0.006), TGF1β(p=0.002), L-Selectin(p=0.005). It was seen elevated in SDRT and CME groups. This shows that IL1 β causes expression of many other cytokines which are still under evaluation.
Interleukin 17 (IL-17) is an infrequently studied inflammatory cytokine which has been shown to be involved in chronic inflammatory diseases whose potential role in Diabetic Retinopathy is still a budding research question. IL-17 stimulates VEGF expression in diabetic patients affected by macular edema from Retinal Endothelial Cells38.
Our study holds few limitations. First, the number of patients enrolled are relatively low, which might alter some minor significant association between biomarkers. Secondly, vitreous humour samples are far superiorto aqueous samples for accurate detection of cytokine concentration. However, obtaining vitreous samples is tedious and obtaining aqueous fluid samples from the anterior chamber is easier, faster and less risky. Thirdly, this was a retrospective study of stored aqueous samples, and there were differences in the timing of sample collection that may have affected some of the mediators analyzed. Fourthly, the levels of some cytokines showed large variations so we included cytokines that were measurable at least in 50% of controls. Fifth, patient might have some concomitant other systemic morbidities which are not evaluated in detail.Lastly, we cannot be certain that cataract patients taken as controls would not differ from eyes without cataract in relation to aqueous cytokine profiles.
CONCLUSION
An incredible advancement in the treatment options of DME is observed with a paradigm shift from observation and macular laser photocoagulation to intravitreal pharmacologic therapies of corticosteroids and anti-VEGF agents. Recent understanding of the complex pathways of inflammation involved in DME have helped in development of more targeted therapy. Insight into association of various inflammatory and angiogenic mediators with DME helping in expanding treatment strategy towards individual drug therapy. In our study we tried establishing a correlation between cytokines, OCT patterns especially in Non responders which might provide a stratagem in customising treatment which leads to achieving and maintaining long term sustained Visual acuity gains.
More conclusive data with larger sample size are needed to determine if certain cytokines play a crucial role in any particular pattern of DME in patients with varied response to treatment.
REFERENCES
- IDF Diabetes Atlas. 6th ed. Brussels, Belgium: International Diabetes Federation; 2013.
- World Health Organization. Fact Sheet N 138. Geneva, Switzerland: WHO; 2002.
- He F, Xia X, Wu XF, Yu XQ, Huang FX. Diabetic retinopathy in predicting diabetic nephropathy in patients with type 2 diabetes and renal disease: a meta-analysis. Diabetologia. 2013;56(3):457–66
- Hagg S, Thorn LM, Putaala J, Liebkind R, Harjutsalo V, Forsblom CM, et al. Incidence of stroke according to presence of diabetic nephropathy and severe diabetic retinopathy in patients with type 1 diabetes Diabetes Care. 2013;36(12):4140–6
- Klein R, Knudtson MD, Lee KE, Gangnon R, Klein BE. The Wisconsin Epidemiologic Study of Diabetic Retinopathy XXIII: the twenty-five-year incidence of macular edema in persons with type 1 diabetes. Ophthalmology. 2009;116(3):497–503.
- Jousssen AM, Poulaki V, Le ML, et al. A central role for inflammation in the pathogenesis of diabetic retinopathy. FASEB J 2004;18:1450 –52.
- Adamis AP, Berman AJ. Immunological mechanisms in the pathogenesis of diabetic retinopathy. Semin Immunopathol 2008;30:65– 84.
- Lu M, Perez VL, Ma N, et al. VEGF increases retinal vascular ICAM-1 expression in vivo. Invest Ophthalmol Vis Sci 1999;40:1808 –12.
- Qaum T, Xu Q, Joussen AM, et al. VEGF-initiated blood retinal barrier breakdown in early diabetes. Invest Ophthalmol Vis Sci 2001;42:2408 –13.
- Zhang SX, Wang JJ, Gao G, et al. Pigment epithelium-derived factor (PEDF) is an endogenous antiinflammatory factor.FASEB J 2006;20:323–5.
- Koleva-Georgieva DN, Sivkova NP, Terzieva D. Serum inflammatory cytokines IL-1beta, IL-6, TNF-alpha and VEGF have influence on the development of diabetic retinopathy. Folia Med (Plovdiv)2011;53:44–50.
- Maier R, Weger M, Haller-Schober EM, El-Shabrawi Y, Wedrich A, Theisl A, et al. Multiplex bead analysis of vitreous and serum concentrations of inflammatory and proangiogenic factors in diabetic patients.Mol Vis. 2008;27(14):637–43
- Dong N, Xu B, Wang B, Chu L. Study of 27 aqueous humor cytokines in patients with type 2 diabetes with or without retinopathy.Molecular Vision. 2013;19:1734-1746.
- Tashimo A, Mitamura Y, Nagai S, Nakamura Y, Ohtsuka K, Mizue Y, et al. Aqueous levels of macrophage migration inhibitory factor and monocyte chemotactic protein-1 in patients with diabetic retinopathy. Diabet Med. 2004;21:1292–7.
- Liu J, Shi B, He S, Yao X, Willcox MDP, Zhao Z. Changes to tear cytokines of type 2 diabetic patients with or without retinopathy.Molecular Vision. 2010;16:2931-2938.
- Kim NR, Kim YJ, Chin HS, Moon YS. Optical coherence tomographic patterns in diabetic macular oedema: prediction of visual outcome after focal laser photocoagulation. Br J Ophthalmol. 2009 Jul;93(7):901-5.
- Otani T, Kishi S, Maruyama Y. Patterns of diabetic macular oedema with optical coherence tomography.Am J Ophthalmol 1999; 127: 88–93.
- Browning DJ, Glassman AR, Aiello LP, et al. Optical coherence tomography measurements and analysis methods in optical coherence tomography studies of diabetic macular edema. Ophthalmology 2008;115:1366–71.
- Ehrlich R, Harris A, Ciulla TA, Kheradiya N, Winston DM, Wirostko B. Diabetic macular oedema: physical, physiological and molecular factors contribute to this pathological process. Acta Ophthalmol 2010;88(3):279 –291.
- Funatsu H, Noma H, Mimura T, Eguchi S, Hori S. Association of vitreous inflammatory factors with diabetic macular edema. Ophthalmology. 2009 Jan;116(1):73-9.
- Funatsu H, Yamashita H, Ikeda T, Mimura T, Eguchi S, Hori S. Vitreous levels of interleukin-6 and vascular endothelial growth factor are related to diabetic macular edema. Ophthalmology. 2003 Sep;110(9):1690-6.
- Funatsu H, Yamashita H, Sakata K, Noma H, Mimura T, Suzuki M, Eguchi S, Hori Vitreous levels of vascular endothelial growth factor and intercellular adhesion molecule 1 are related to diabetic macular edema. Ophthalmology. 2005 May;112(5):806-16.
- Funatsu H, Yamashita H, Nakamura S, Mimura T, Eguchi S, Noma H, Hori S. Vitreous levels of pigment epithelium-derived factor and vascular endothelial growth factor are related to diabetic macular edema. Ophthalmology. 2006 Feb;113(2):294-301
- Sohn HJ, Han DH, Kim IT, Oh IK, Kim KH, Lee DY, Nam DH. Changes in aqueous concentrations of various cytokines after intravitreal triamcinolone versusbevacizumab for diabetic macular edema. Am J Ophthalmol. 2011 Oct;152(4):686-94.
- Roh MI, Kim HS, Song JH, Lim JB, Kwon OW. Effect of intravitreal bevacizumab injection on aqueous humour cytokine levels in clinically significant macular edema. Ophthalmology. 2009;116:80–6.
- Kim JY, Jeong YJ, Park SP (2014) Different Concentrations of Aqueous Cytokines According to Diabetic Macular Edema Patterns as Determined Optical Coherence Tomography. J Clin Exp Ophthalmol 5:380
- Kim M, Kim Y, Lee SJ. Comparison of aqueous concentrations of angiogenic and inflammatory cytokines based on optical coherence tomography patterns of diabetic macular edema. Indian J Ophthalmol. 2015 Apr;63(4):312-7
- Tesch GH. Role of macrophages in complications of type 2 diabetes.Clin ExpPharmacol Physiol. 2007;34:1016–1019.
- Funk M, Schmidinger G, Maar N, et al. Angiogenic and inflammatory markers in the intraocular fluid of eyes with diabetic macular edema and influence of therapy with bevacizumab. 2010;30:1412–1419.
- Funatsu H, Noma H, Mimura T, et al. Association of vitreous inflammatory factors with diabetic macular edema. 2009;116(1):73–9.
- Zhu D, Zhu H, Wang C, Yang D. Intraocular soluble intracellular adhesion molecule-1 correlates with subretinal fluid height of diabetic macular edema. Indian J Ophthalmol. 2014 Mar;62(3):295-8.32. Joussen AM, Poulaki V, Le ML, et al. A central role of inflammation in the pathogenesis of diabetic retinopathy. FASEB J 2004;18:1450–2.
- Lee,W.J.,M.H. Kang, M. Seong, and H.Y. Cho. 2012. Comparison of aqueous concentrations of angiogenic and inflammatory cytokines in diabetic macular oedema and macular oedema due to branch retinal vein occlusion. British Journal of Ophthalmology 96: 1426–1430
- Jian-Jang You;Chang-Hao Yang; Jen-Shang Huang; Muh-Shy Chen; Chung-May YangFractalkine,a CX3C Chemokine, as a Mediator of Ocular Angiogenesis Investigative Ophthalmology & Visual Science November 2007, Vol.48, 5290-5298.
- Liu, Y., M. Biarnes Costa, and C. Gerhardinger. 2012. IL-1beta is upregulated in the diabetic retina and retinal vessels: cell-specific effect of high glucose and IL-1beta autostimulation. PLoS One 7: e36949.
- Kumar, A., and N. Shamsuddin. 2012. Retinal Muller glia initiate innate response to infectious stimuli via toll-like receptor signaling. PLoS One 7: e29830
- Itakura H, Akiyama H , Hagimura N , Doi H , Tanaka T , Kishi S , Kurabayashi MTriamcinolone acetonide suppresses interleukin-1 beta-mediated increase in vascular endothelial growth factor expression in cultured rat Muller cells.Graefe’s Archive for Clinical and Experimental Ophthalmology 2006, 244(2):226-231
- Ajay Pillai;Anna Lisa Montemari; Chaunte Stampley; Curran Dalal; Folami Lamoke; Babak Baban; Manuela BartoliInterleukin 17 Stimulates STAT3-dependent VEGF Expression in Retinal Endothelial Cells Investigative Ophthalmology & Visual Science April 2011, Vol.52, 3547
FIGURE LEGENDS
A)Spongy like Diffuse retinal thickening which appears as increased retinal thickness with areas of reduced intra retinal reflectivity seen in a 65 year old treatment naive.
B)Cystoid macular edema which appears as large, ovoid areas of low reflectivity, separated by highly reflective septae that represent intraretinal cystoid-like cavities in a 68 year old non responder.
C)Serous retinal detachment appears as a dark area of subretinal fluid accumulation beneath the highly reflective and dome-like elevation of detached retina in a 55-year old non responder.
D) Combined pattern where there is equitable presence of SDRT and CME seen in 66-year old responder
 .
.